Cold Air Intake Showdown: K&N vs. the Competition
- Jun 27, 2025
Tired of all the keyboard warriors on the internet arguing about what intake makes the most power? So are we, and it’s time to cut through the noise. This article puts three popular intake styles to the test on a 2018 Chevy Silverado: the new K&N NextGen, a closed box competitor, and a discount open airbox competitor. Using airflow, dyno, and track tests, we measure real-world performance to find out what intake is best!
Real Testing, Real Results
If you’ve spent any time in a conversation about automotive upgrades, you know there are more opinions than there are products available. There are myriad aftermarket companies providing some amazing upgrades that can make any car or truck feel and look like a whole different machine. But for every one of these upgrades, there is one person telling you it’s the greatest thing to put on your vehicle, and another saying not to use it unless you want it to spontaneously combust or have the wheels fall off the next day.
The same goes for intake systems.
When K&N started creating intakes, it was the only option available. Three decades later, there are many styles of intakes available on the market, all with their own benefits, materials, costs, and brands. Even K&N has developed multiple styles including different tube colors and materials, heat shields and enclosed boxes, and oiled cotton or dry synthetic air filters. And of course, every one of these options has a line of people waiting to expound on the virtues or problems with each of these designs. Add to that several other competitive brands that have popped up over the years, as well as the inevitable discount knockoffs available online. The confusion and contention around which is best continues to rise.
Well, we’ve spent enough time listening to the keyboard warriors ranting, so we decided to do some real testing and see what we can find out on our own. We do a lot of intake testing at K&N, and we know how our intakes perform, but we don’t spend much time analyzing the competitors, so we thought it was time to do some apples-to-apples comparisons and see what the data tells us.
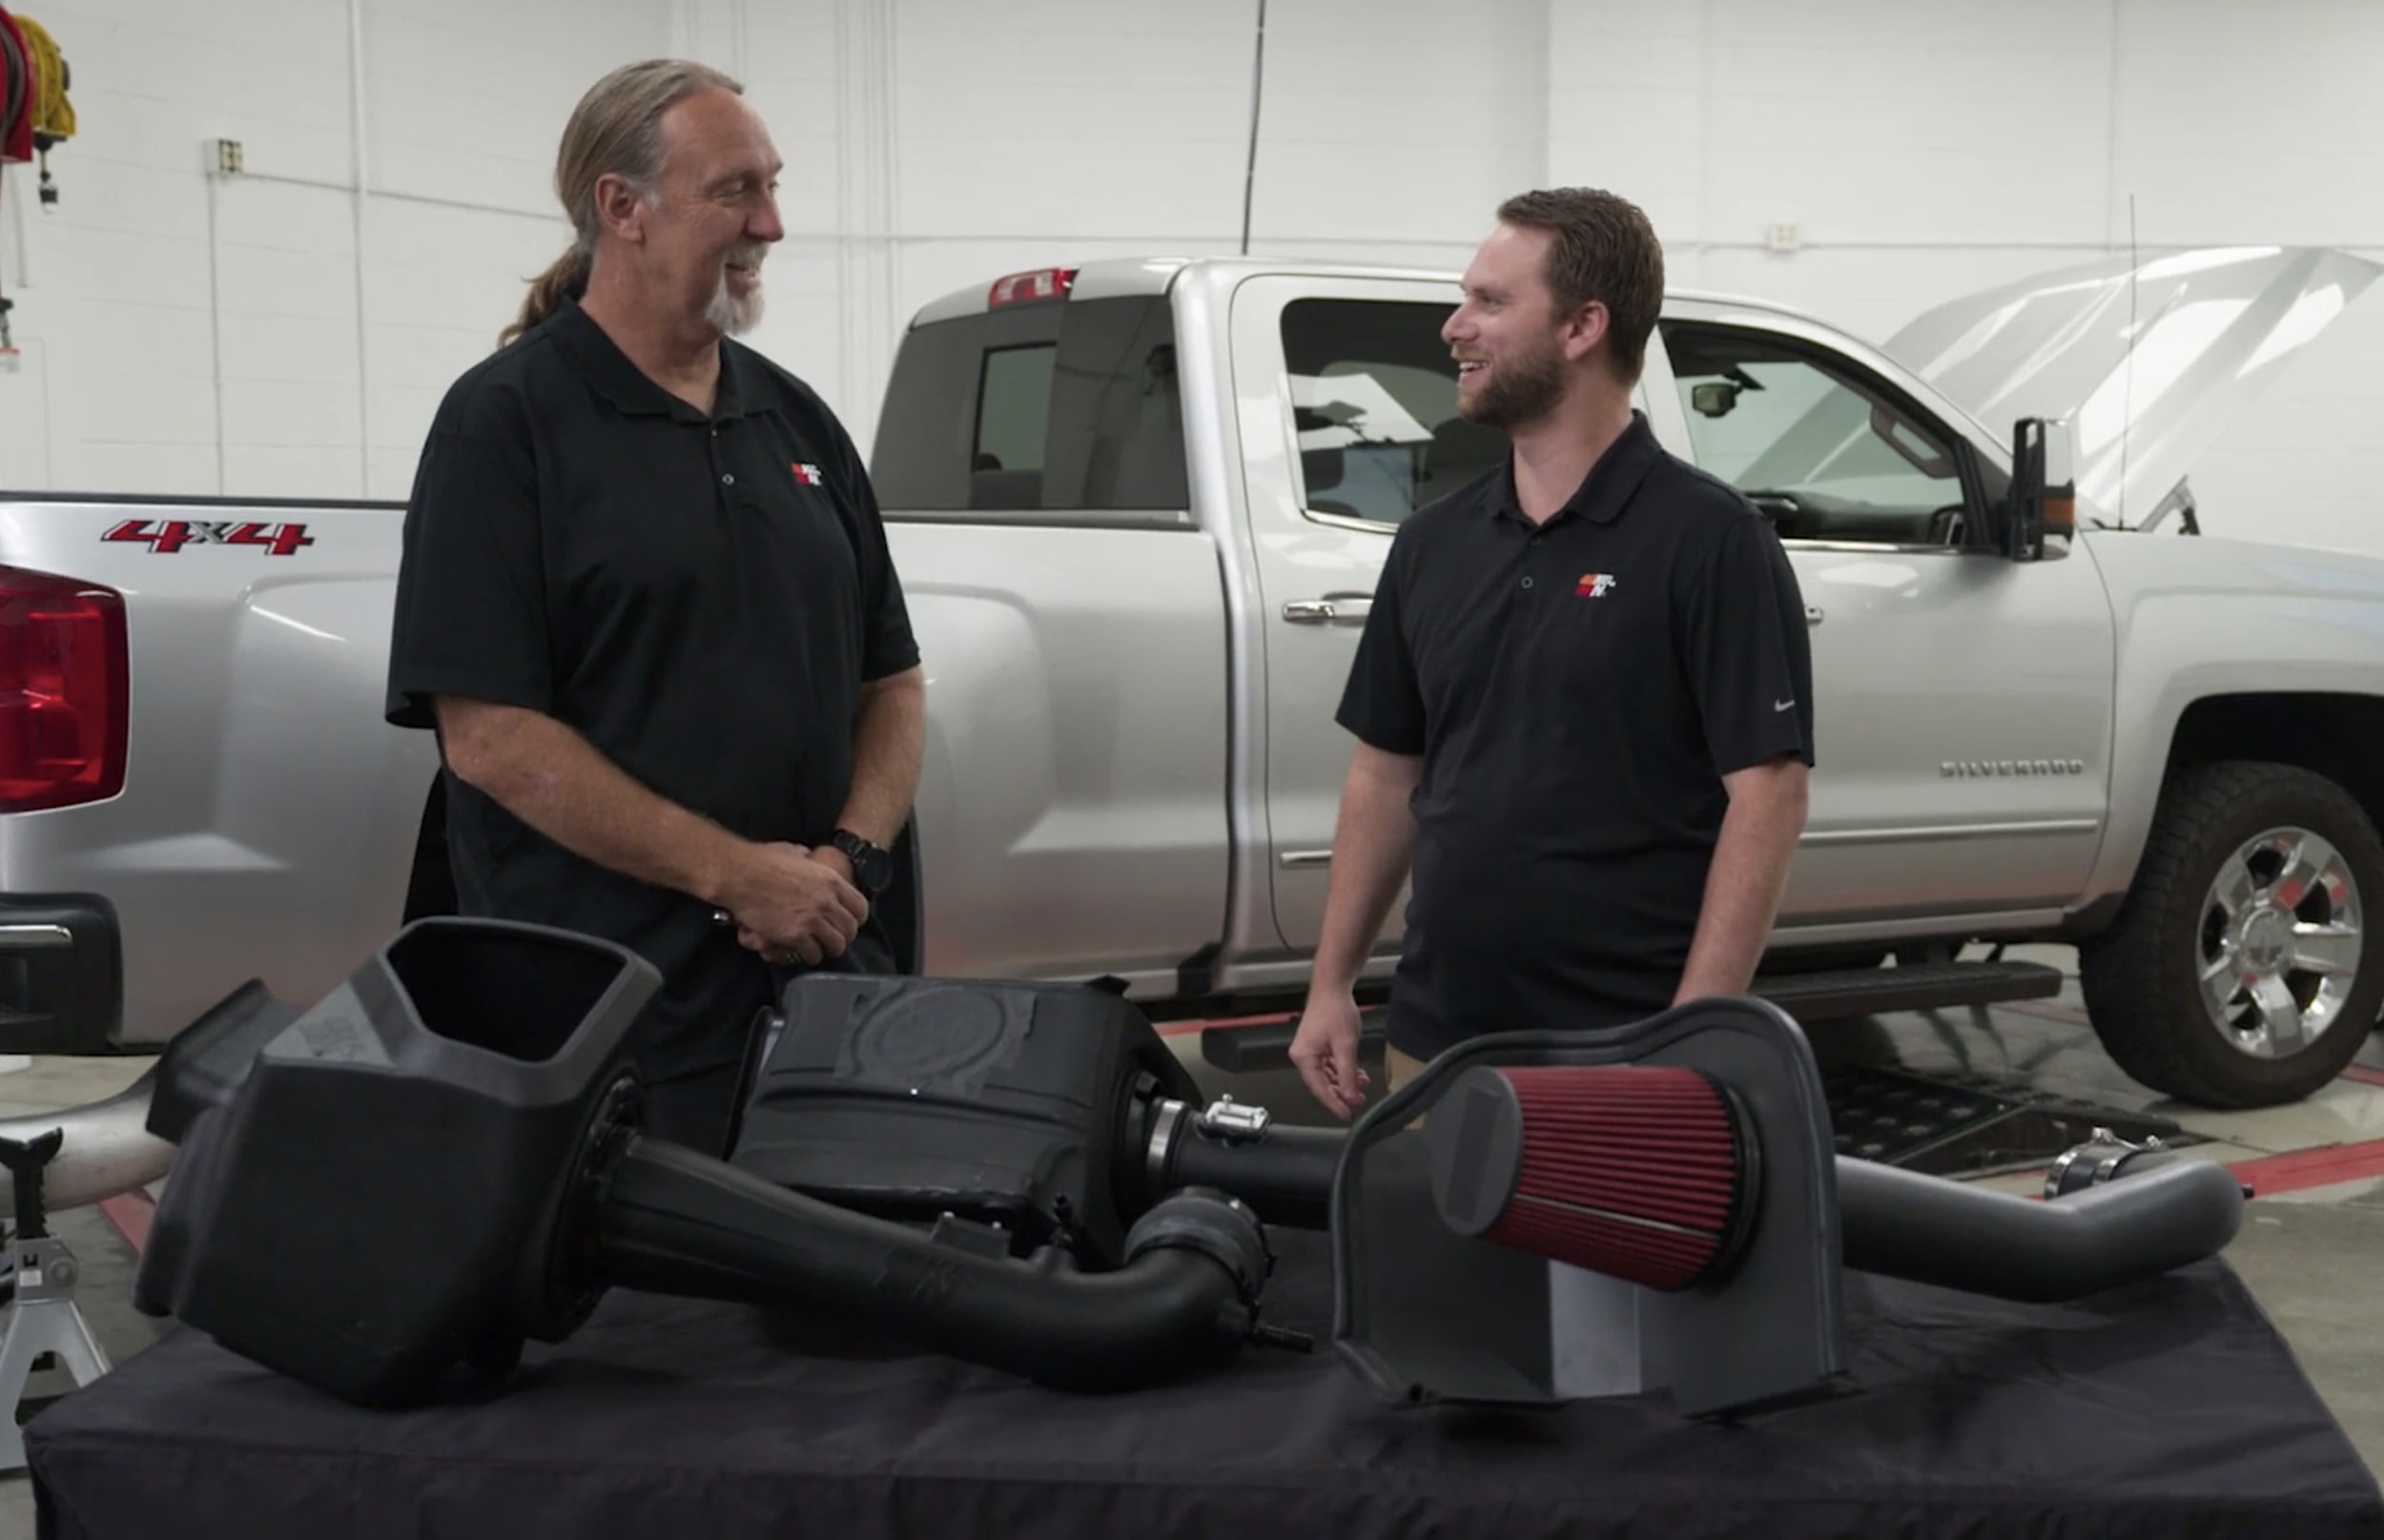
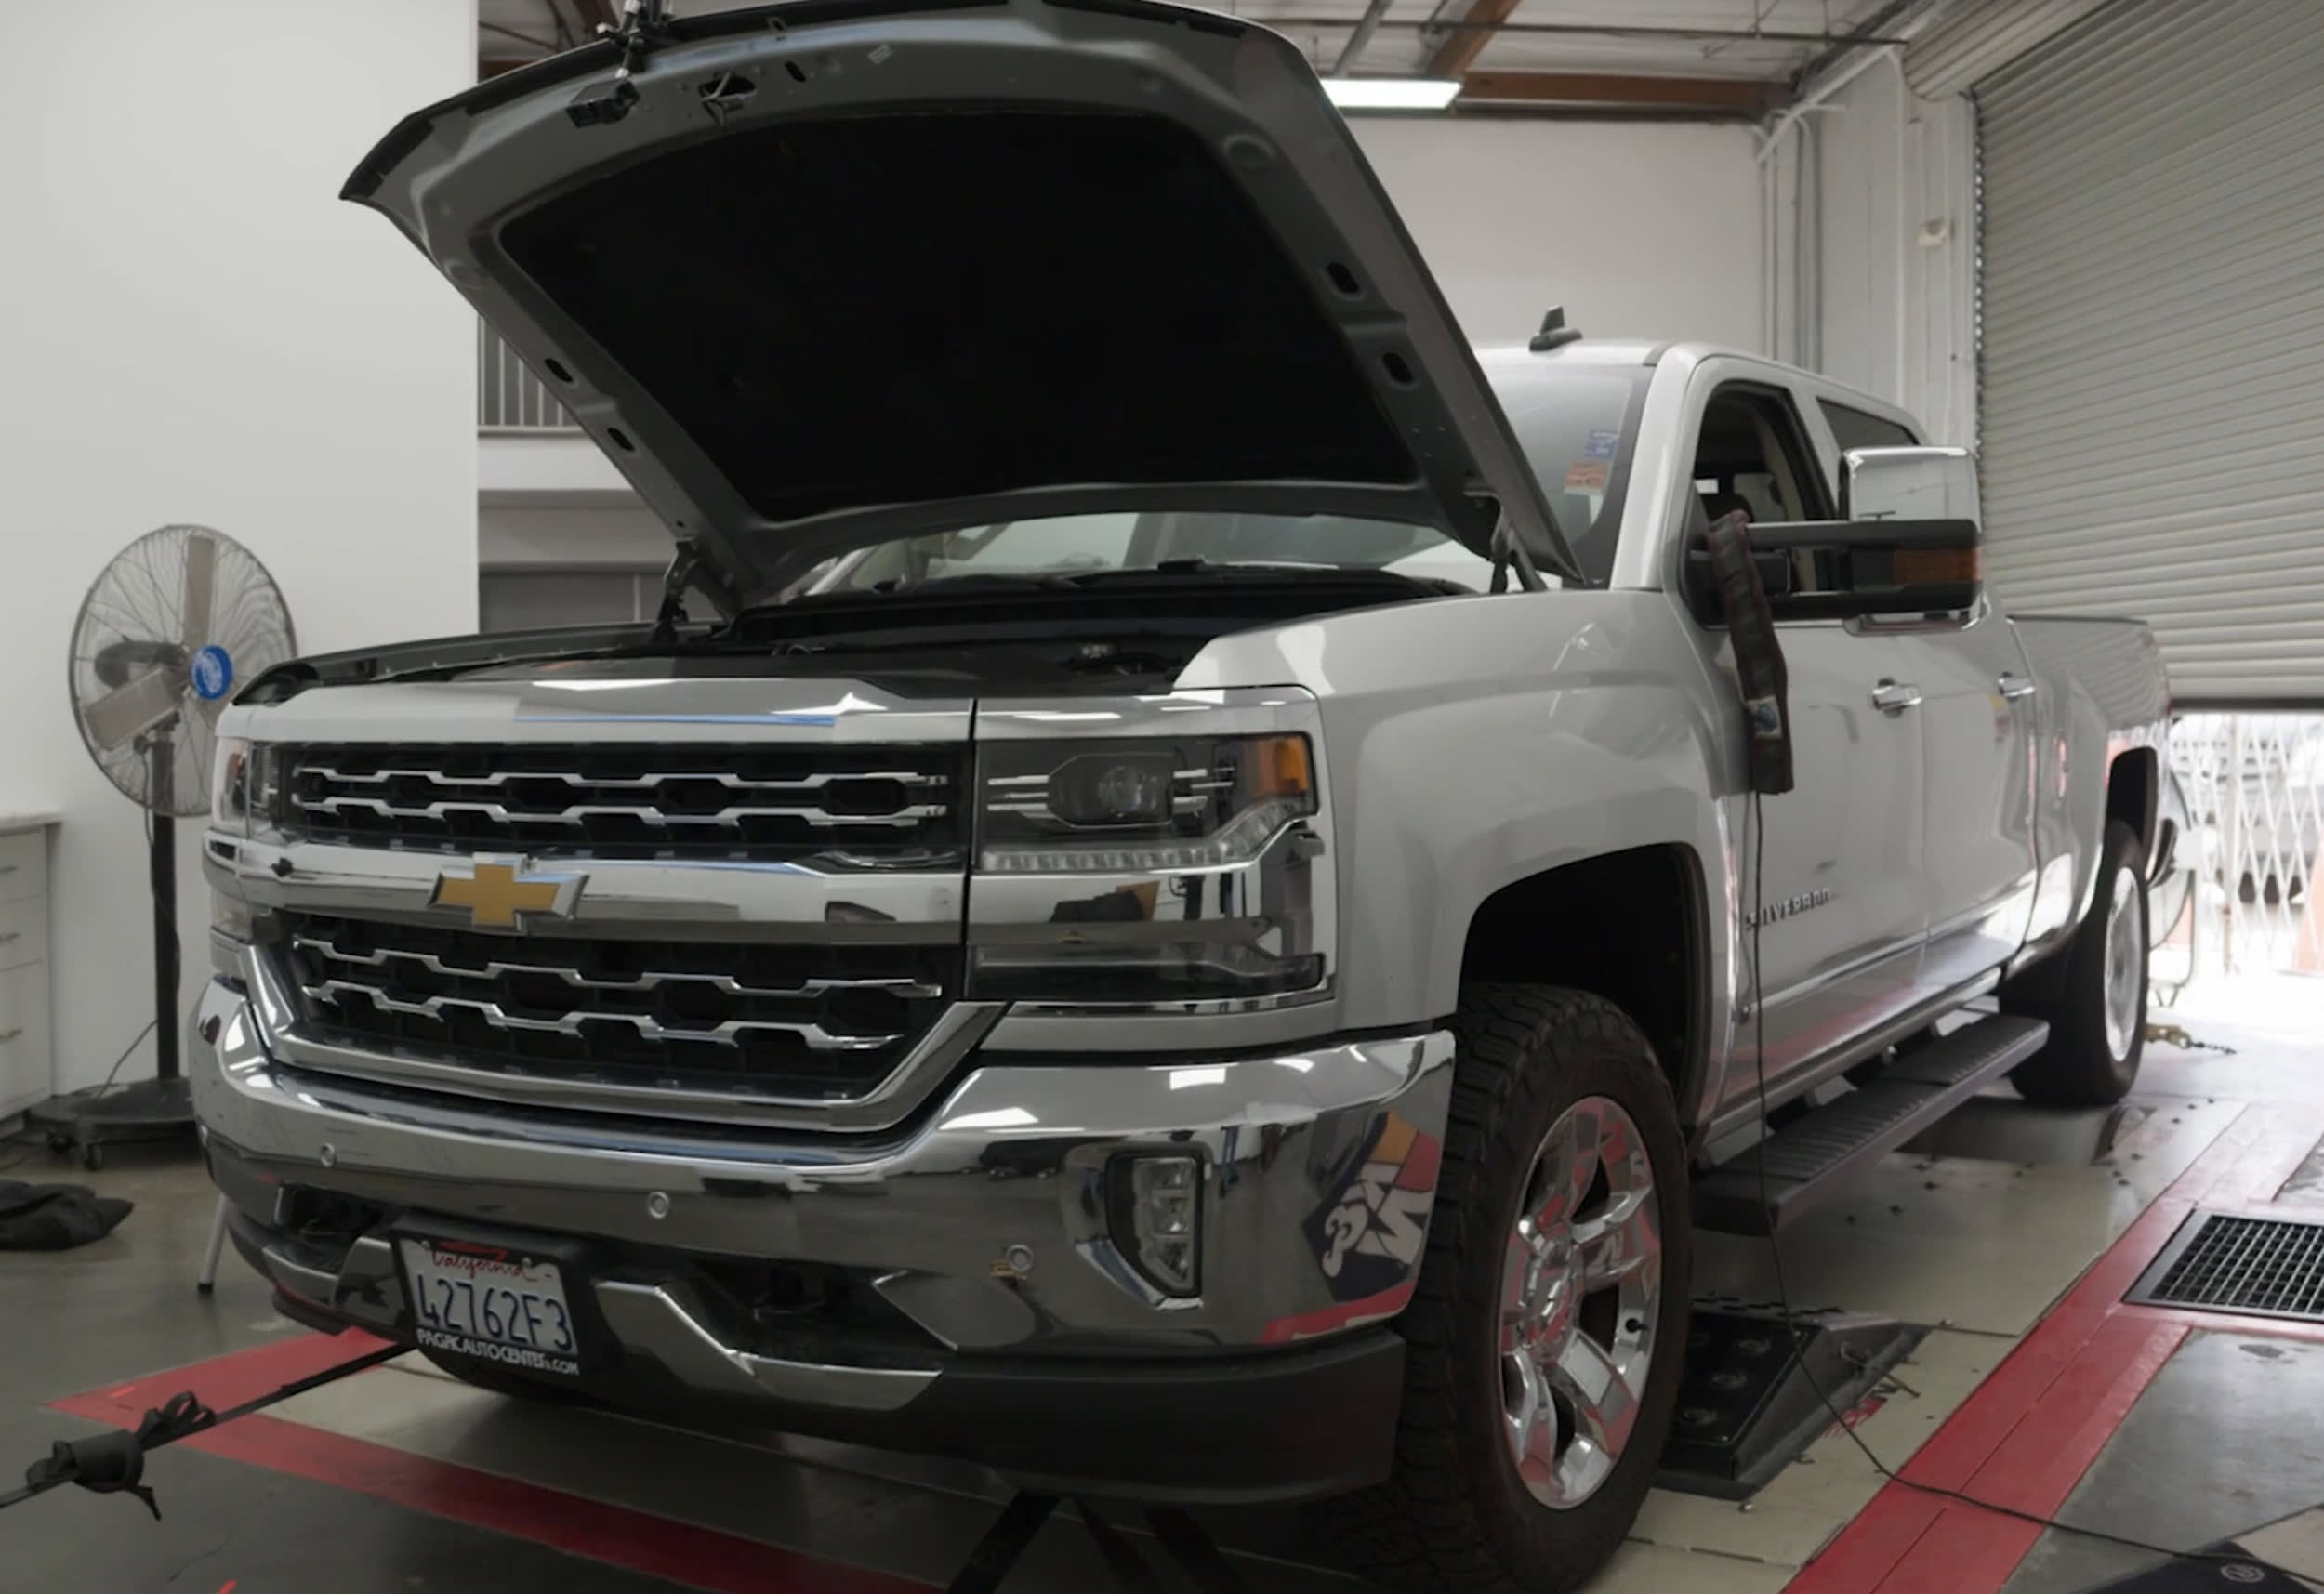
Step one is to choose the competitors. For our tests, we are using a 2018 Chevy Silverado with a 6.2-liter V8 engine. This vehicle allows us a diverse selection of intakes that includes a new K&N NextGen intake, an enclosed box intake from a well-known competitor, and a discount intake from a popular online retailer with an open-air box heat shield style. This gives us a good variety of prices, styles, and quality to compare against the stock intake setup.
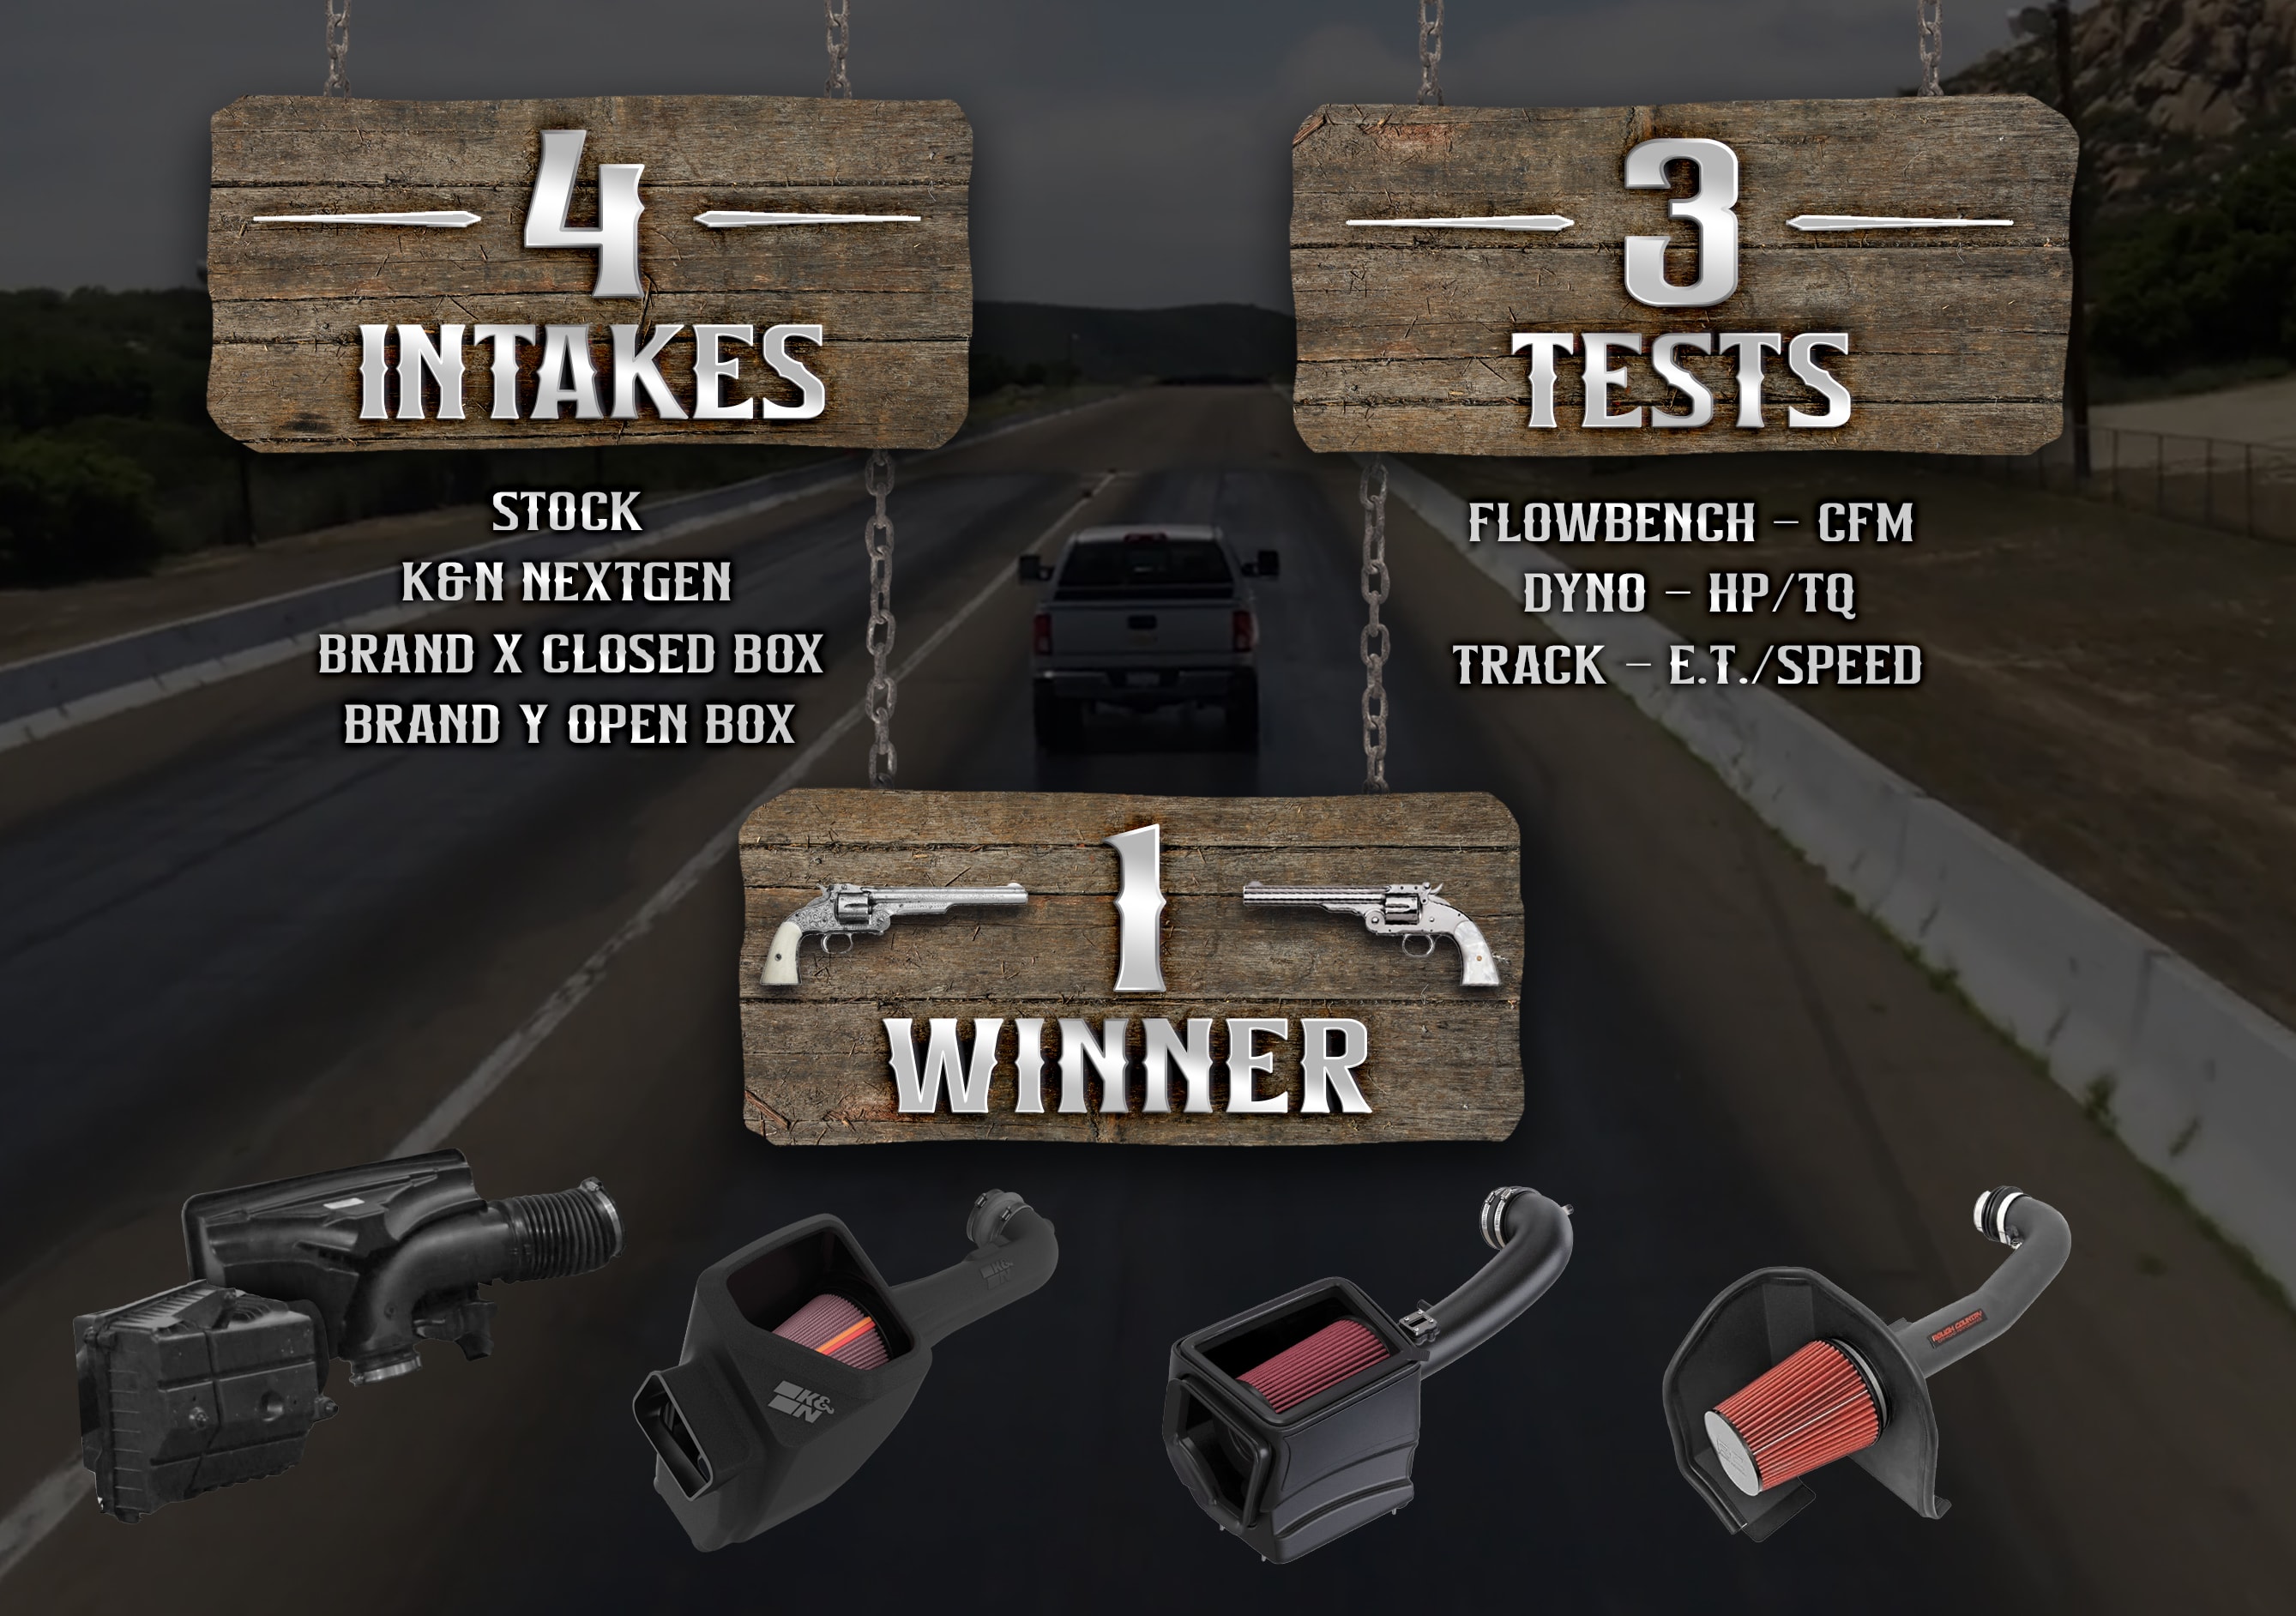
Step two is to design the tests. The goal is to review performance in every way we can measure, so we have three tests to conduct with each intake. Each test follows strict protocols to keep the tests as accurate and fair as possible:
Test 1: Airflow Rates
- Measure CFM (cubic feet per minute) for each intake at both 1.5” and 15” of water restriction
- Test on Superflow 1020 Flowbench
Test 2: Horsepower and Torque Increases
- Measure the average highest horsepower and torque increase compared to stock on three dyno runs with each intake
- Test on Superflow SF880E Dynamometer
Test 3: Acceleration Time and Speed
- Measure average total elapsed time and top speed for three runs down the drag strip with each intake
- Test at 1/8 mile drag strip with official timing equipment
To remove as many variables as possible, the vehicle has a computer plugged into the OBD-2 port for the dyno and track tests. This monitors all essential data and keeps the truck and environmental conditions as close as possible from one test to the next. This includes ambient air temperature, coolant temperature, transmission temperature, test hardware and sensors, and the use of multiple runs to obtain average numbers.
Step three…test the hell out of these intakes!
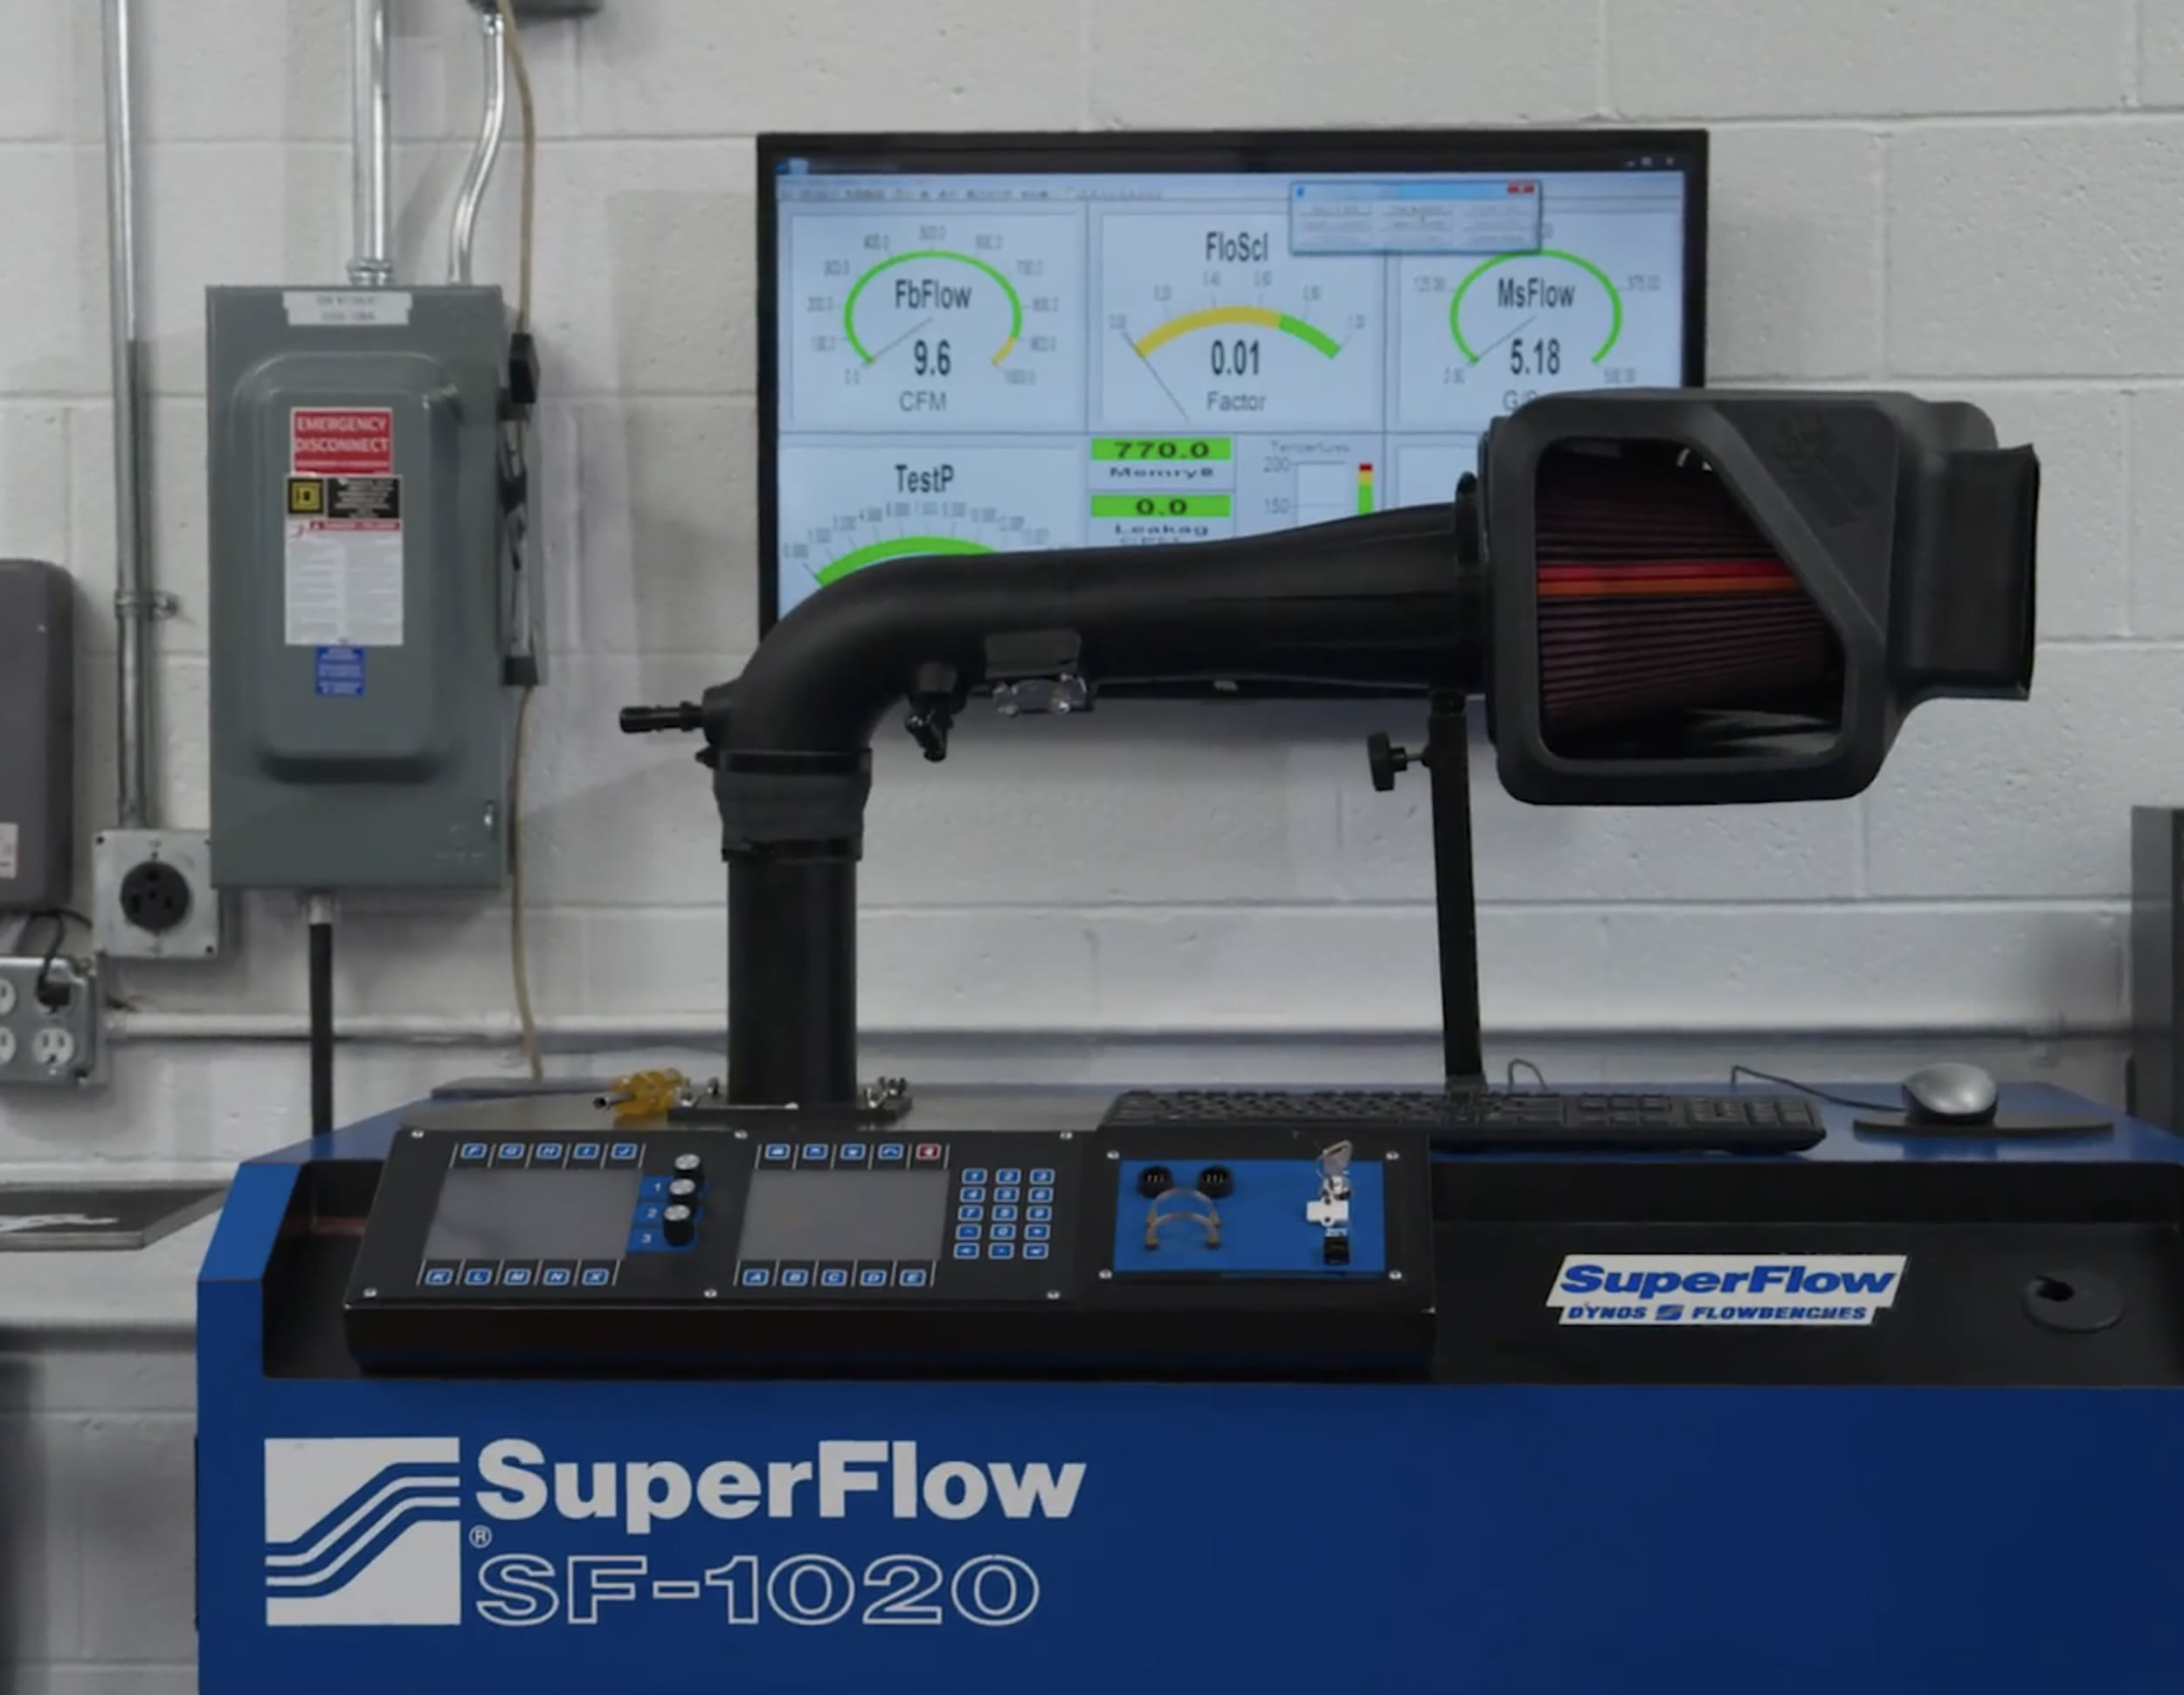
TEST 1: Airflow Increases on the Flowbench
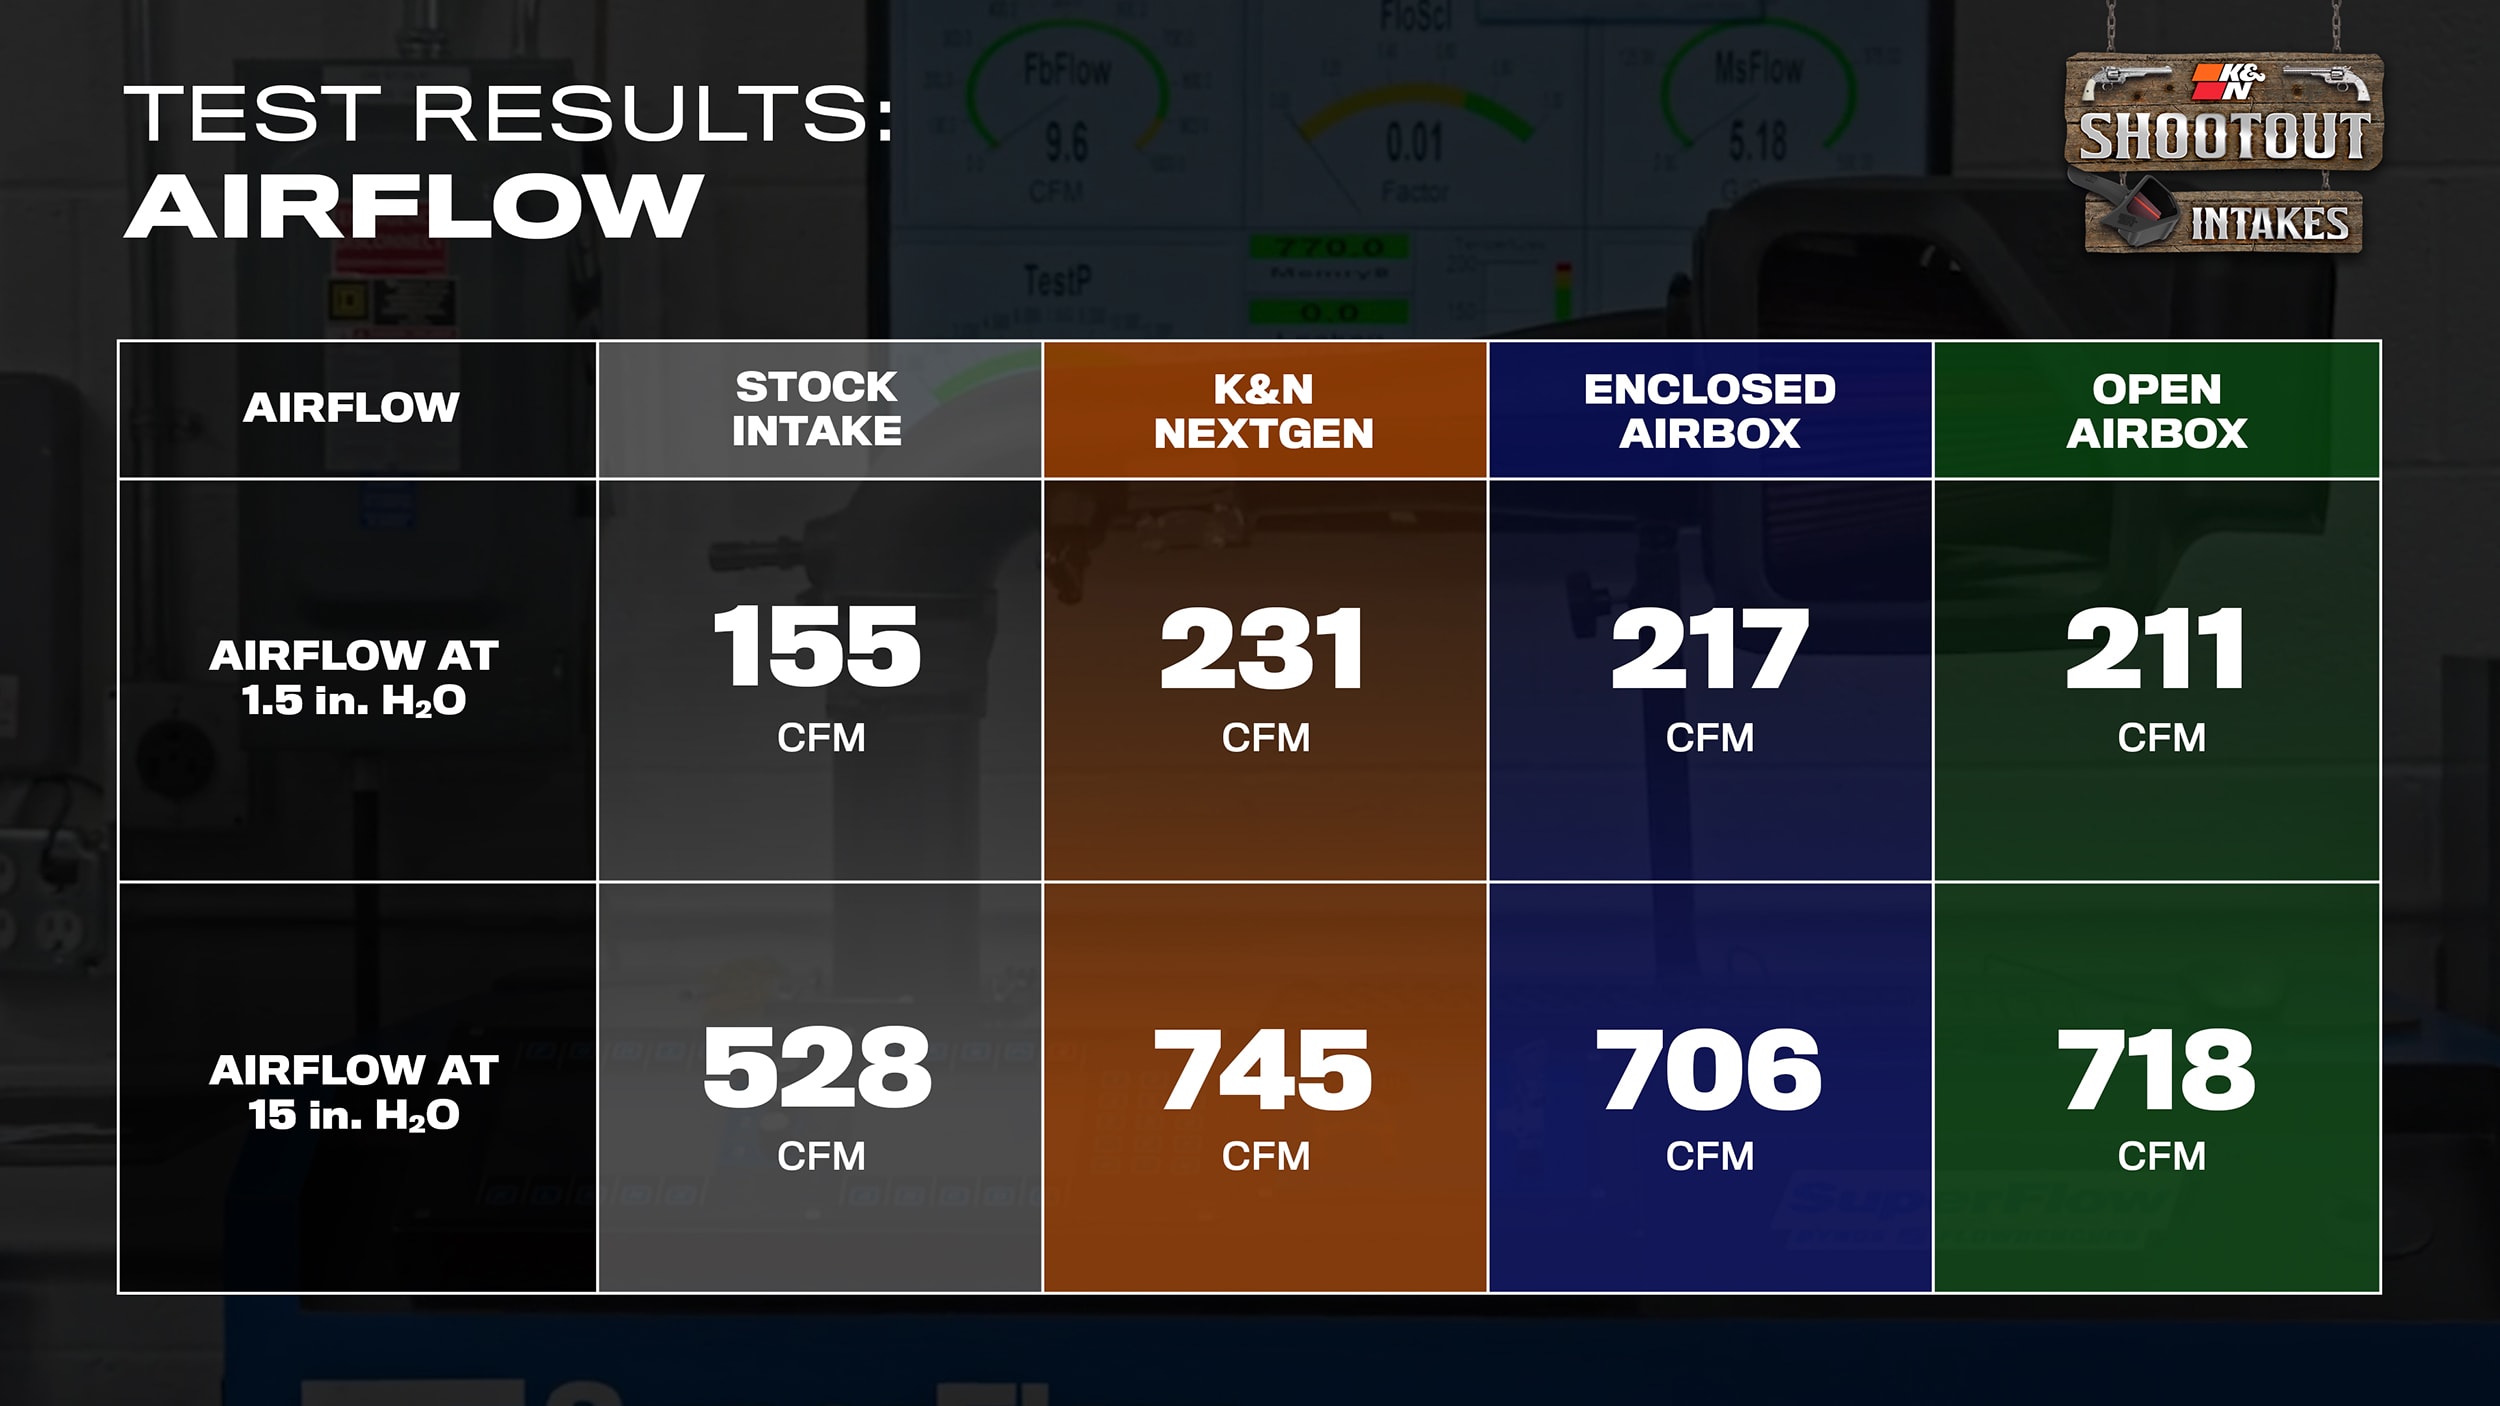
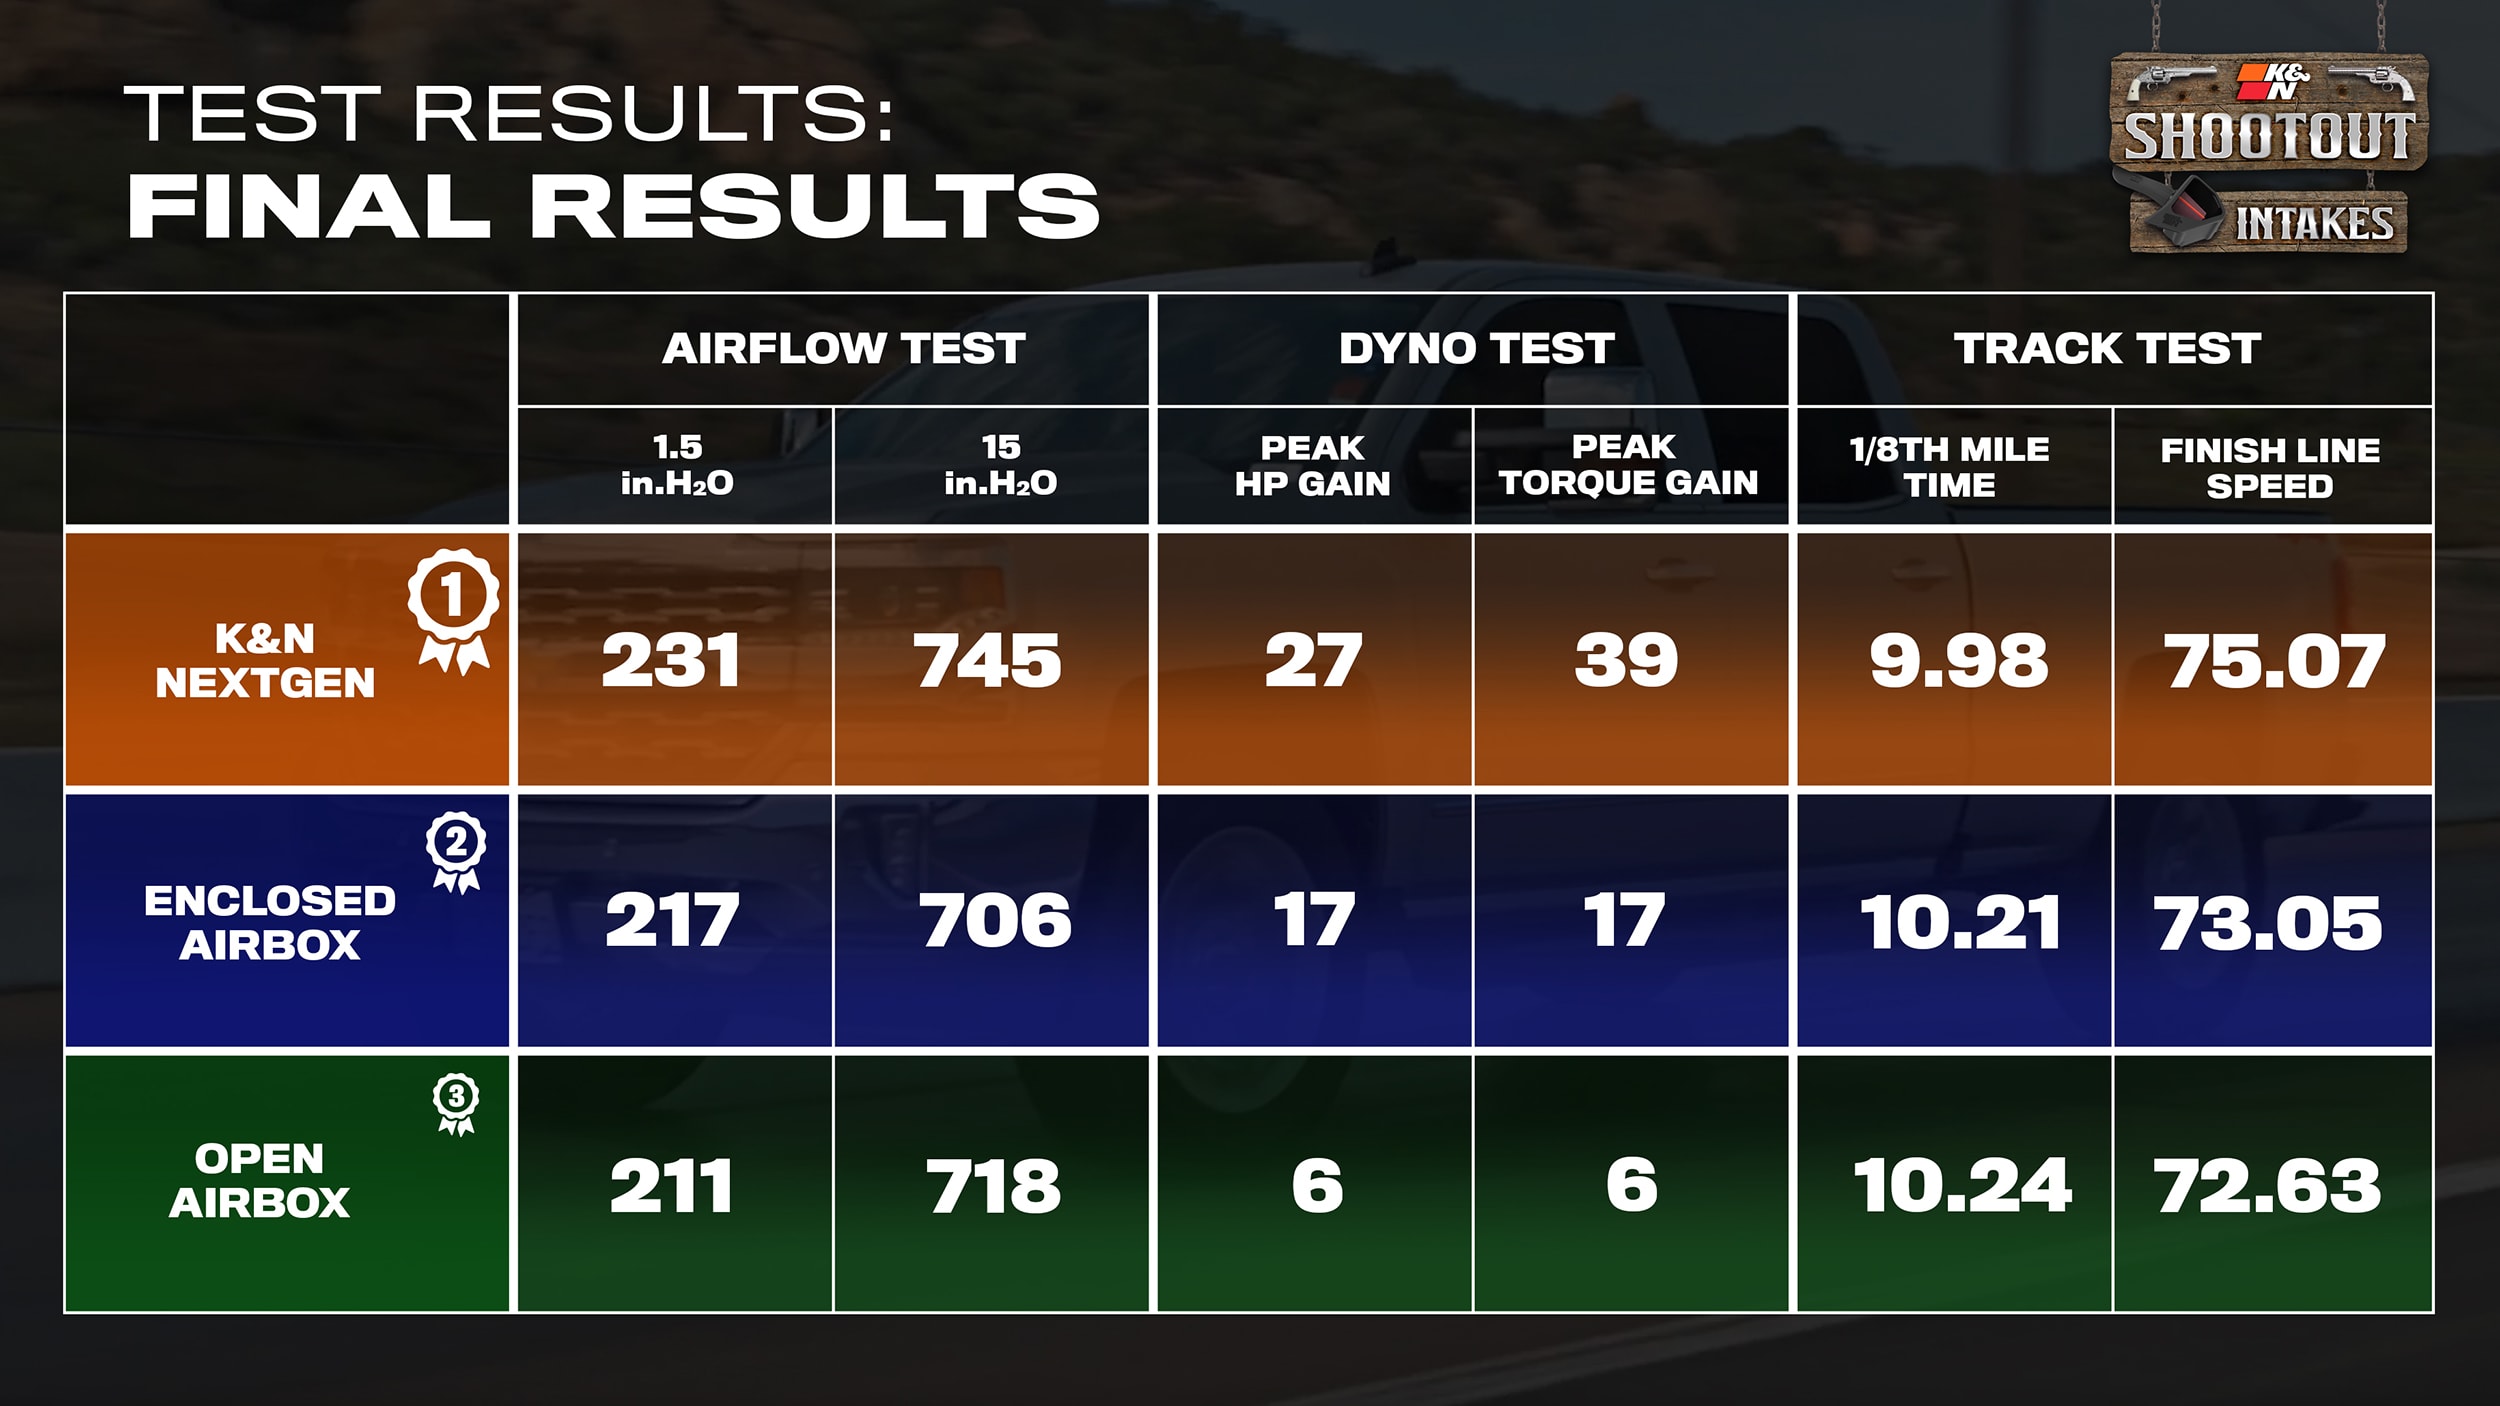
The first stop is the Flowbench for airflow testing. Each intake is assembled and fitted onto the Flowbench and fired up. The CFM rates are tracked starting at 1.5” of water restriction and calculated all the way up to 15” of water, where the test is terminated. After the first test concluded, the stock intake showed a max CFM of 155.1 at 1.5” and 527.6 at 15”. Next up was the K&N NextGen intake, showing a big increase to 231.4 CFM at 1.5” and 745.4 CFM at 15”. Third is the closed box intake coming in at 216.8 CFM at 1.5” and 705.5 CFM at 15”. The open airbox intake finished out the testing, showing 211.0 CFM at 1.5” and 717.8 CFM at 15”. The complete results can be seen below, showing that all three of the aftermarket intakes demonstrated significant airflow increases over stock throughout the test.
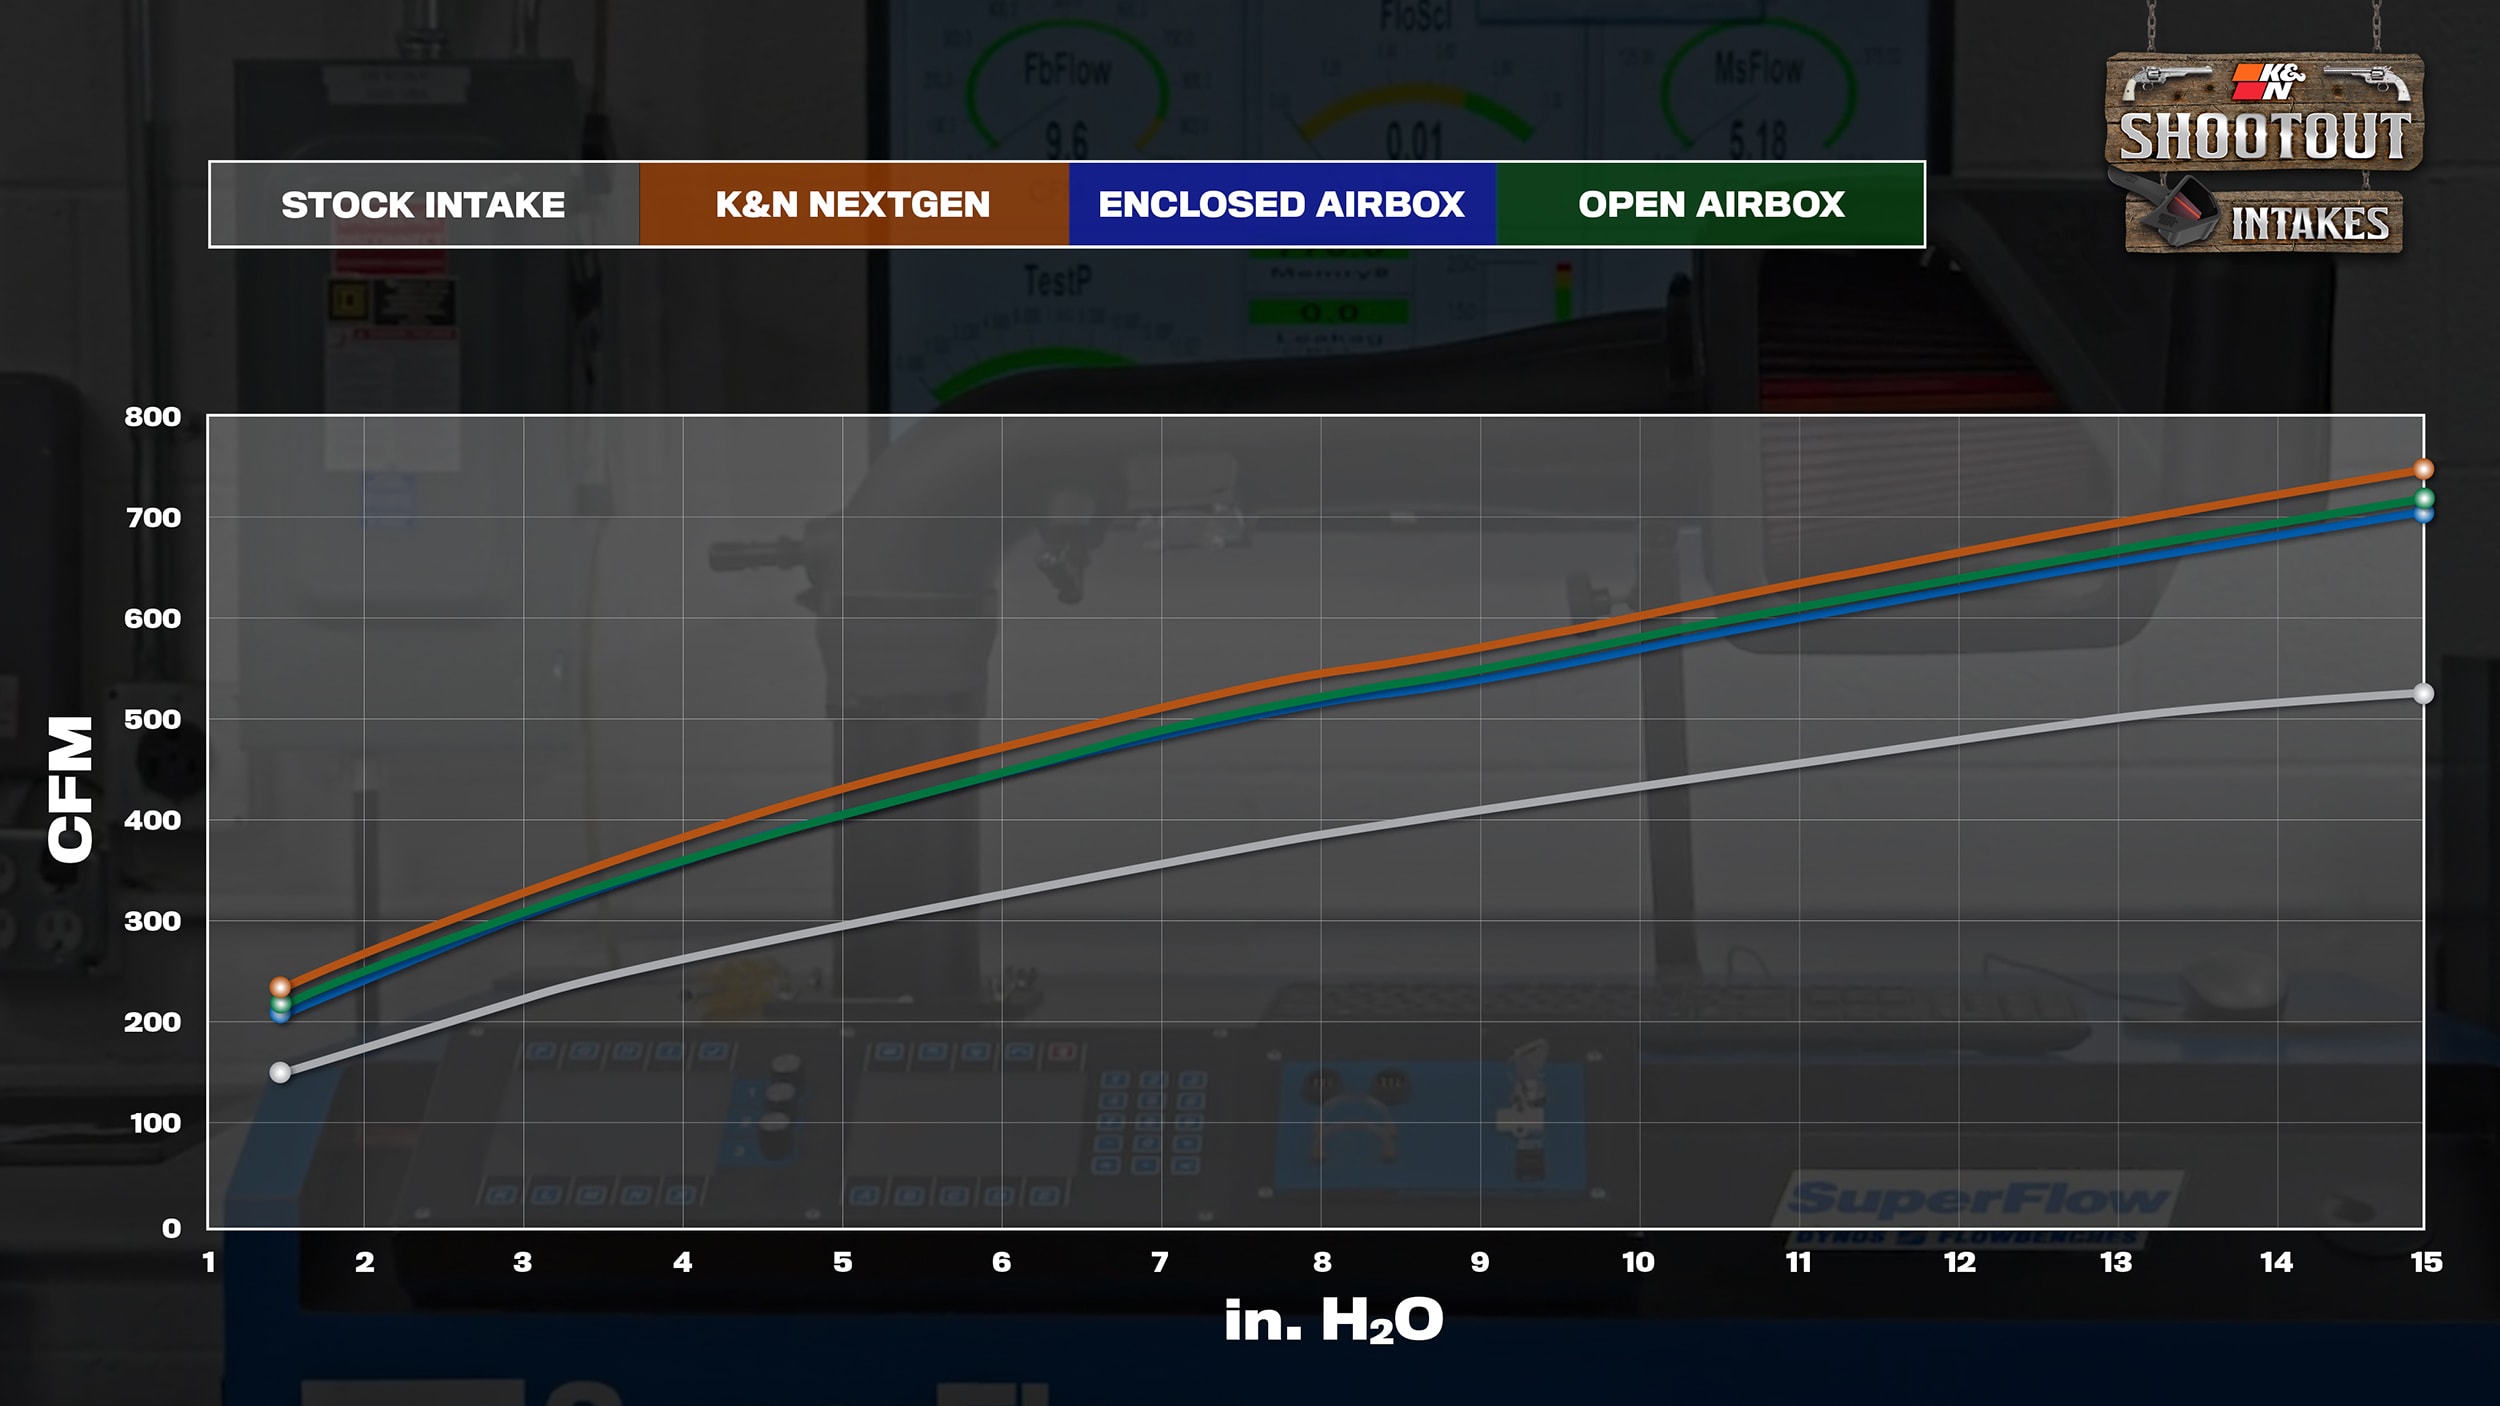
With any true test, there must be a winner. When comparing the numbers, the K&N NextGen intake showed the highest CFM numbers at the 1.5” and 15” levels. Since this is only a first comparison, the next step is heading over to the dyno for some power numbers.
TEST 2: Horsepower and Torque Increases on the Dyno
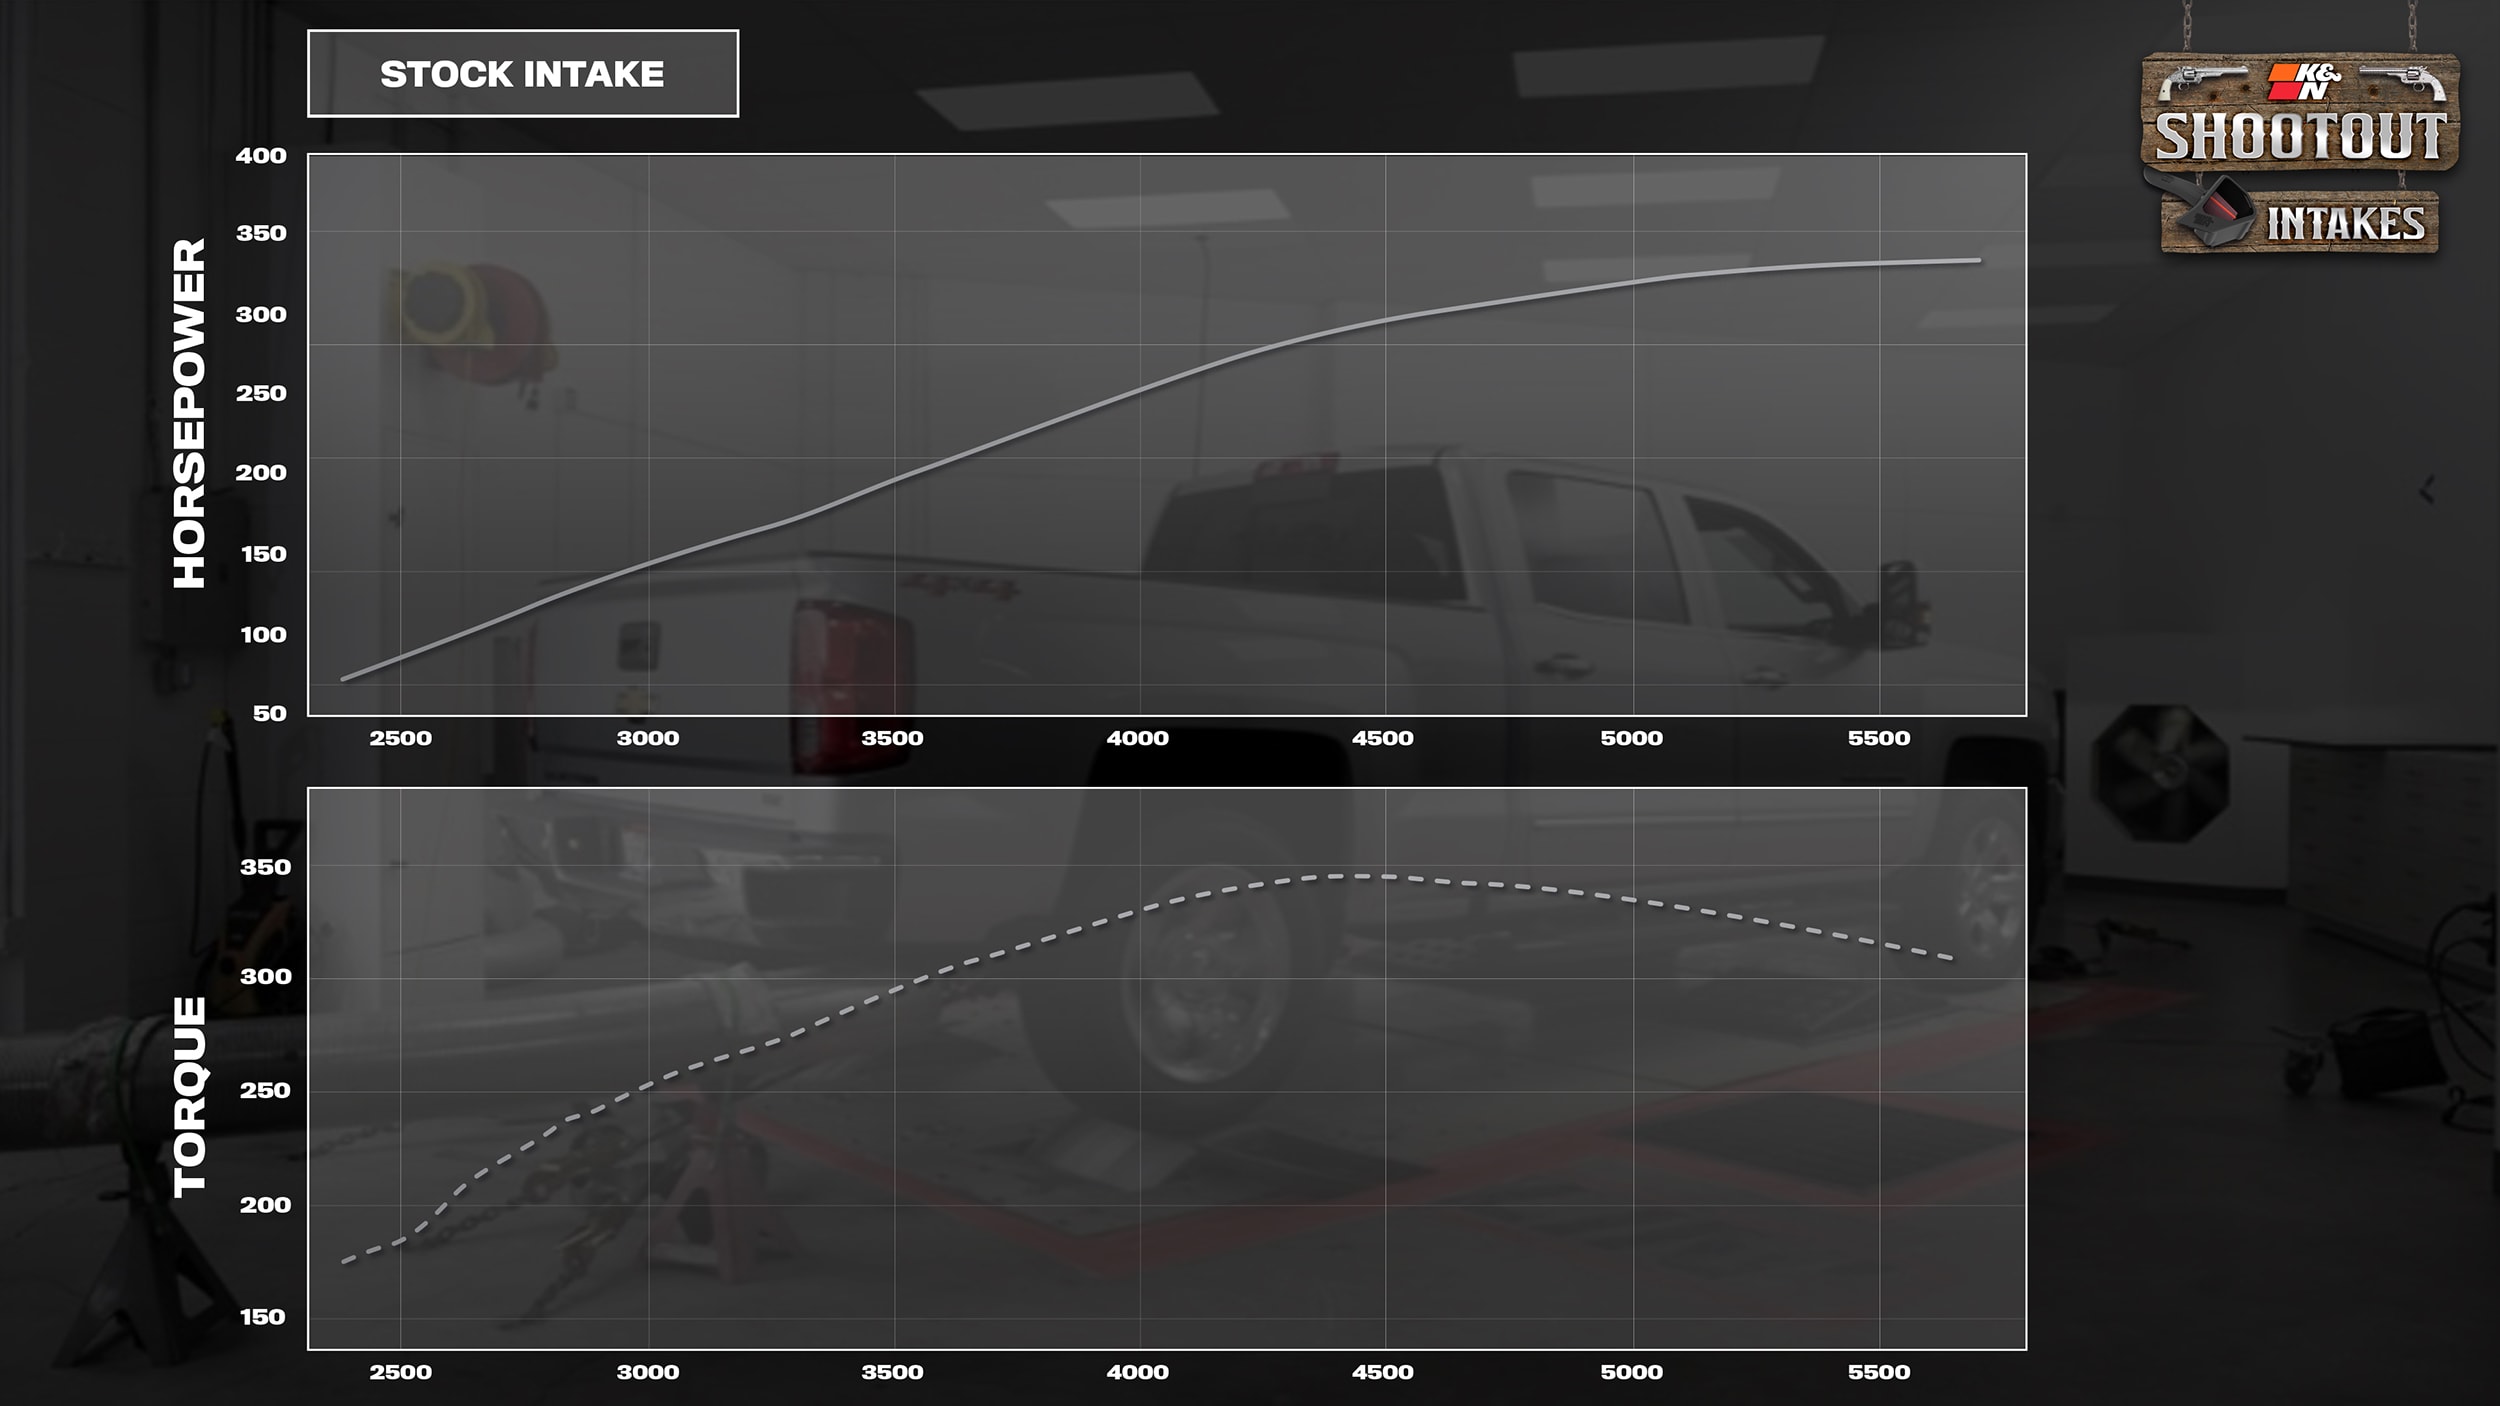
Test two…Dyno time! Once the stock intake is put back on the truck, our test Silverado is strapped down and brought up to operating temps. The first critical step is to get a solid baseline horsepower and torque curve to compare against. After three dyno runs, the graphs are analyzed and the top and bottom runs were removed, leaving the most average result to compare against, shown here:
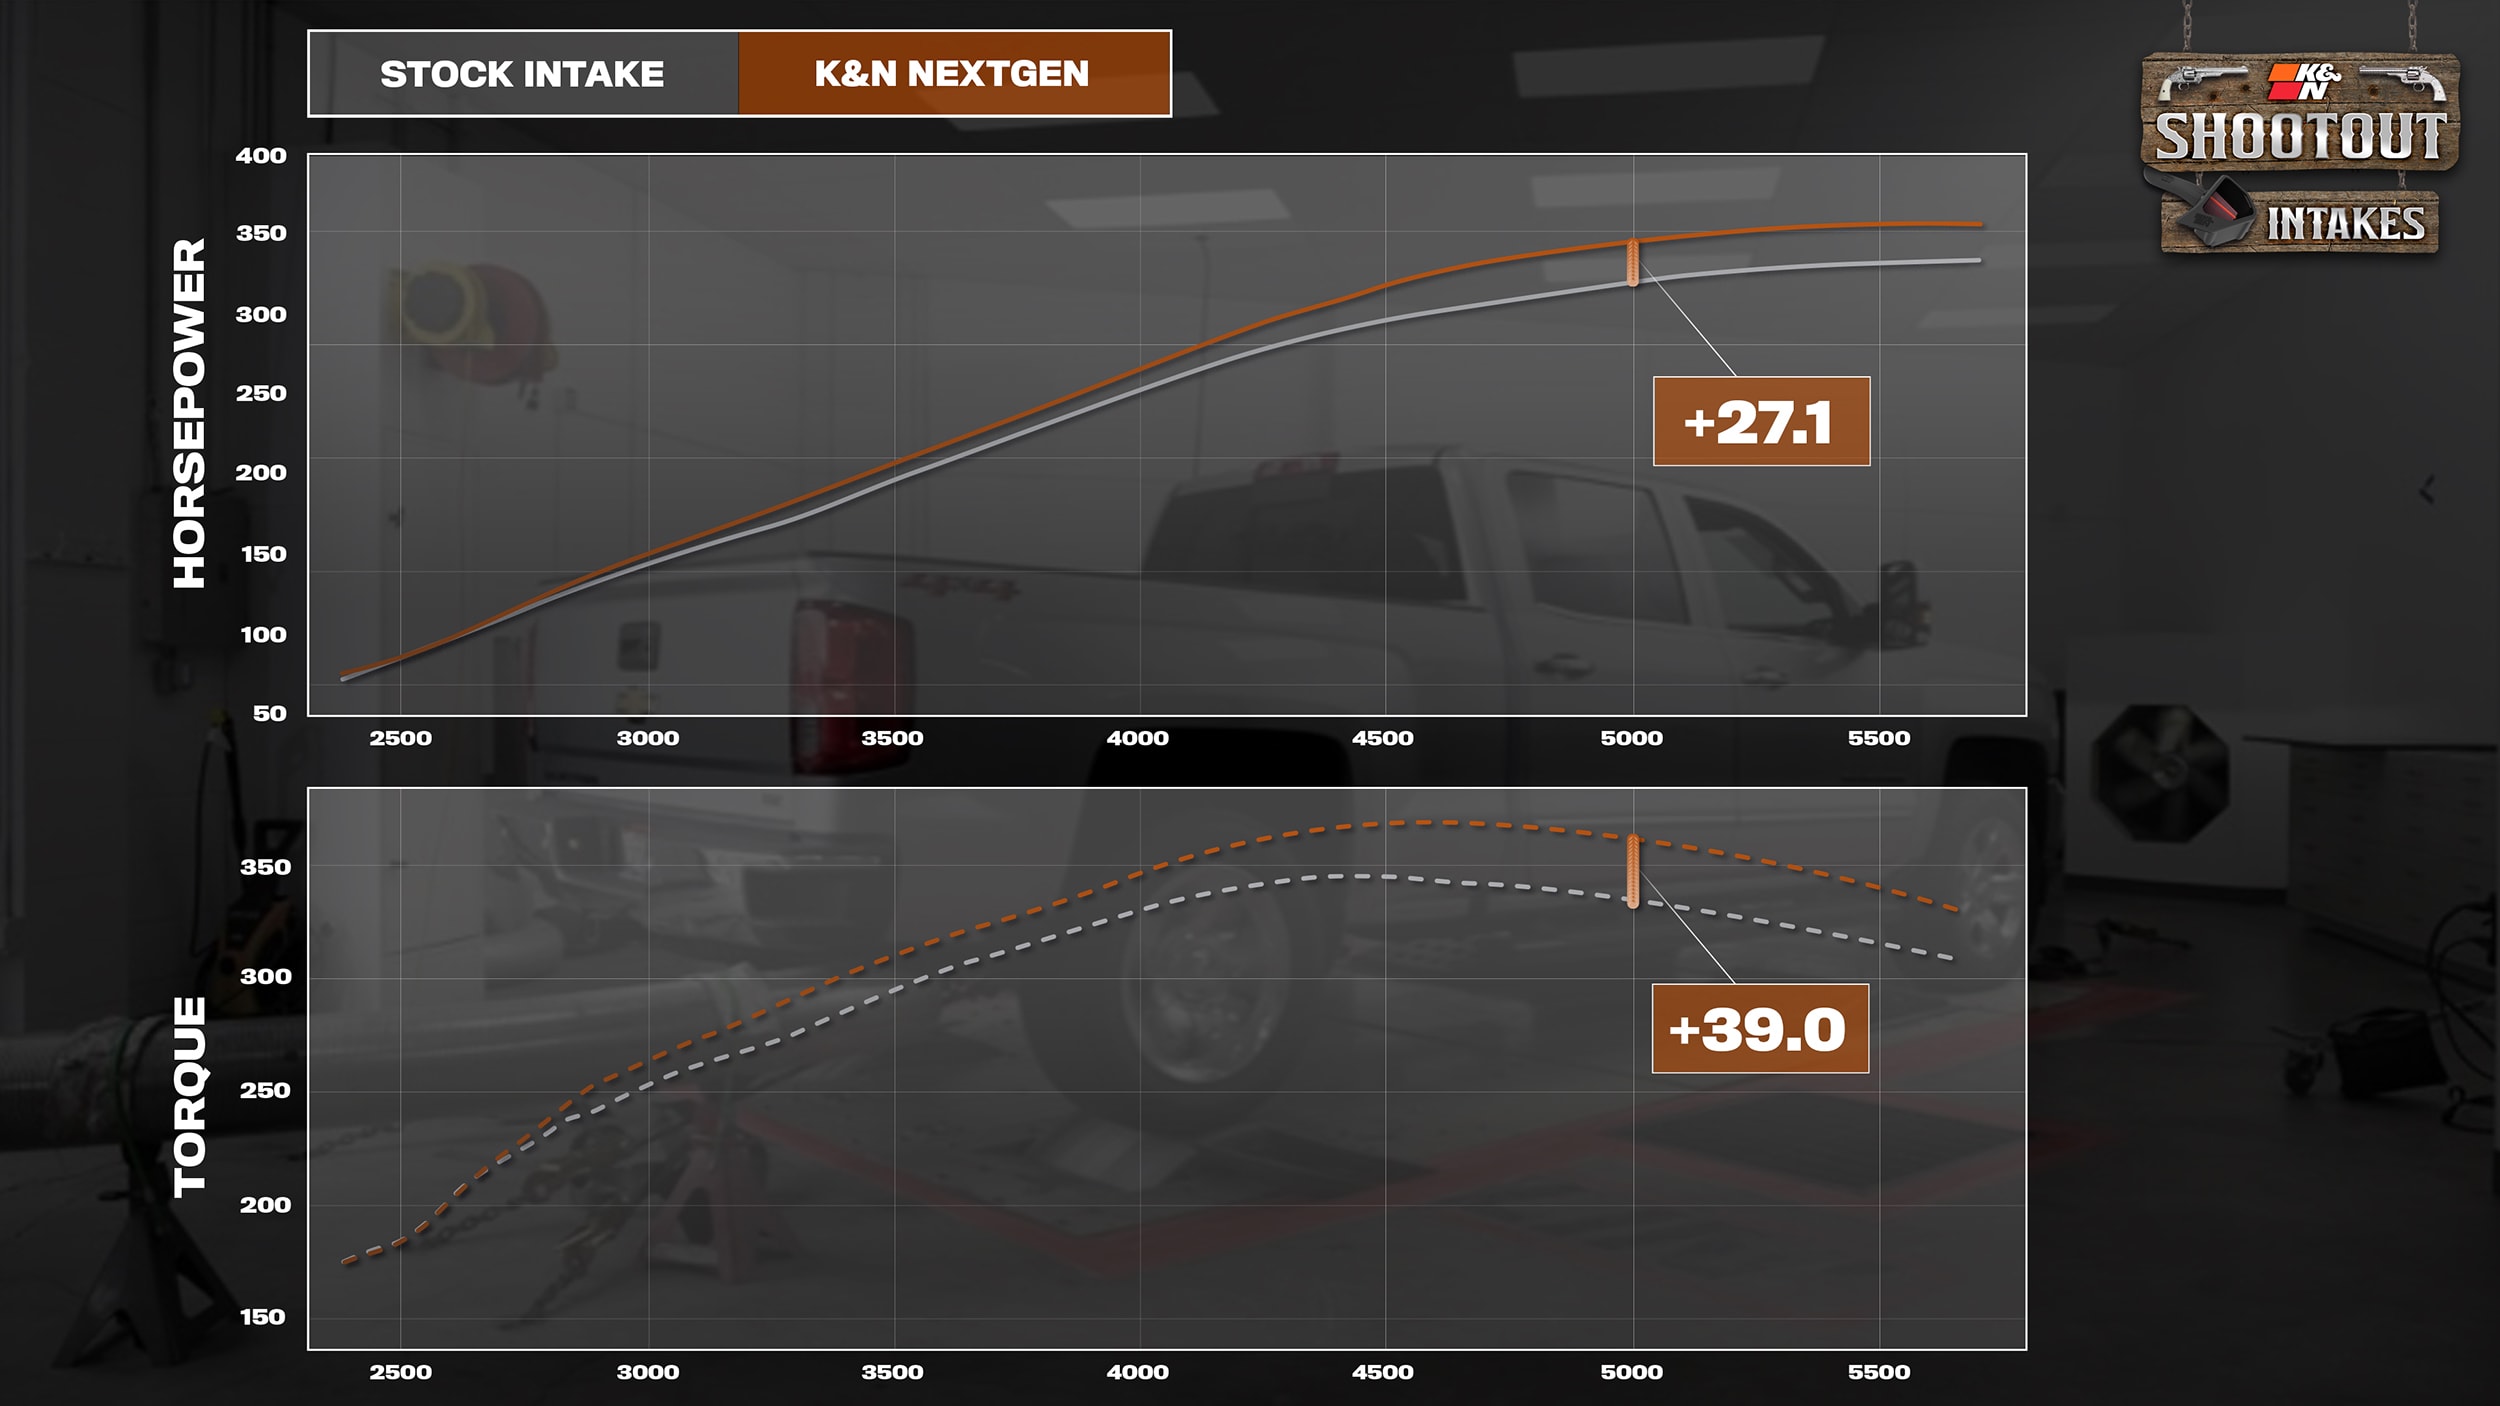
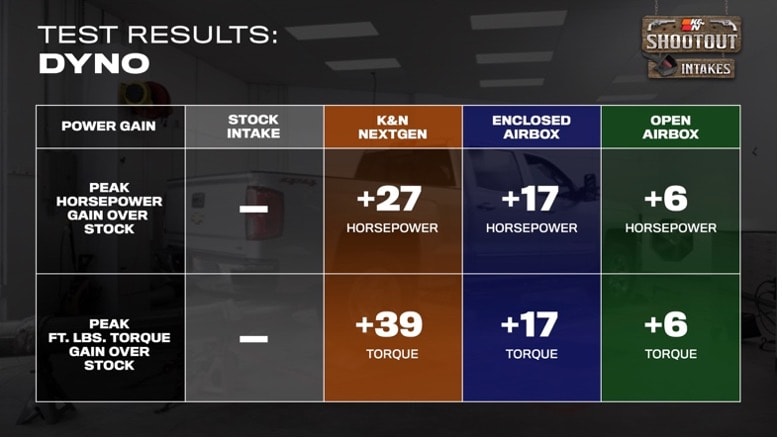
After our baseline is established, the K&N NextGen intake is installed into the truck, and the tech team checks all the numbers to make sure critical temperatures are all similar to the stock test conditions. Once that’s complete, it’s time for three more dyno pulls. After the same process of removing the top and bottom result, a clean comparison graph is created for horsepower and torque showing a max gain of 27.1 horsepower and 39.0-foot pounds of torque at 5,000 RPM.
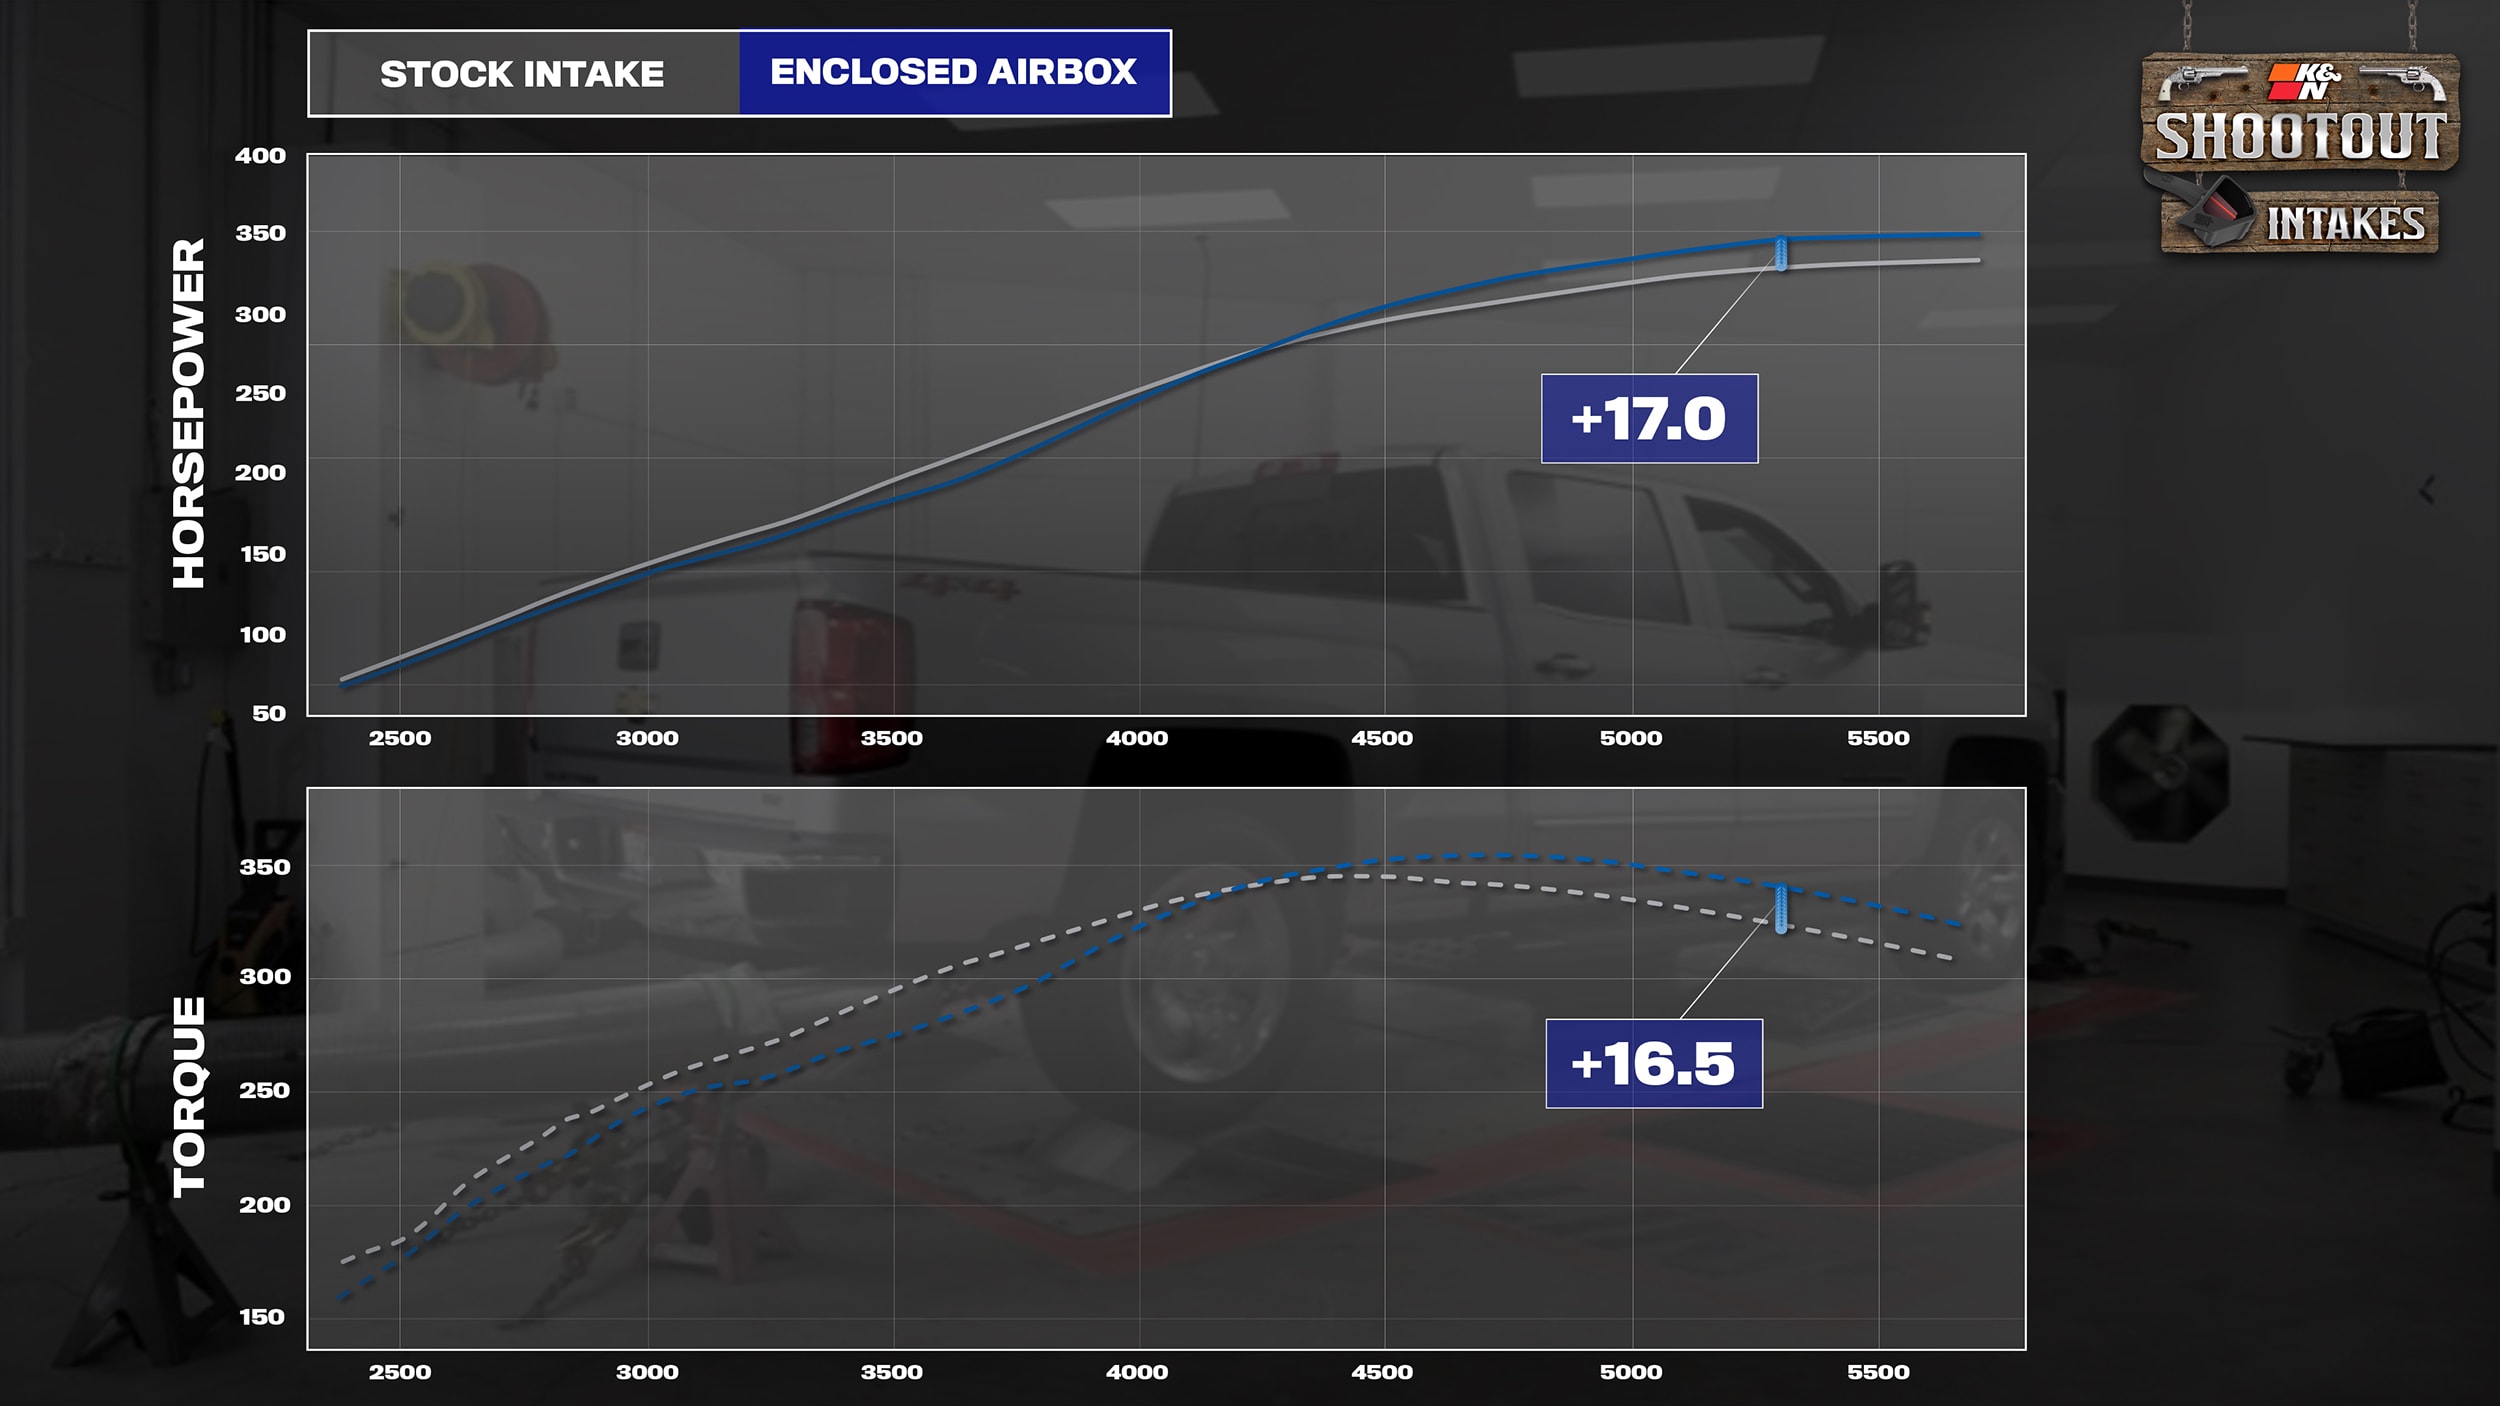
Next up for testing is the closed airbox intake, showing a max gain of 17.0 horsepower and 16.5-foot pounds of torque at 5,300 RPM.
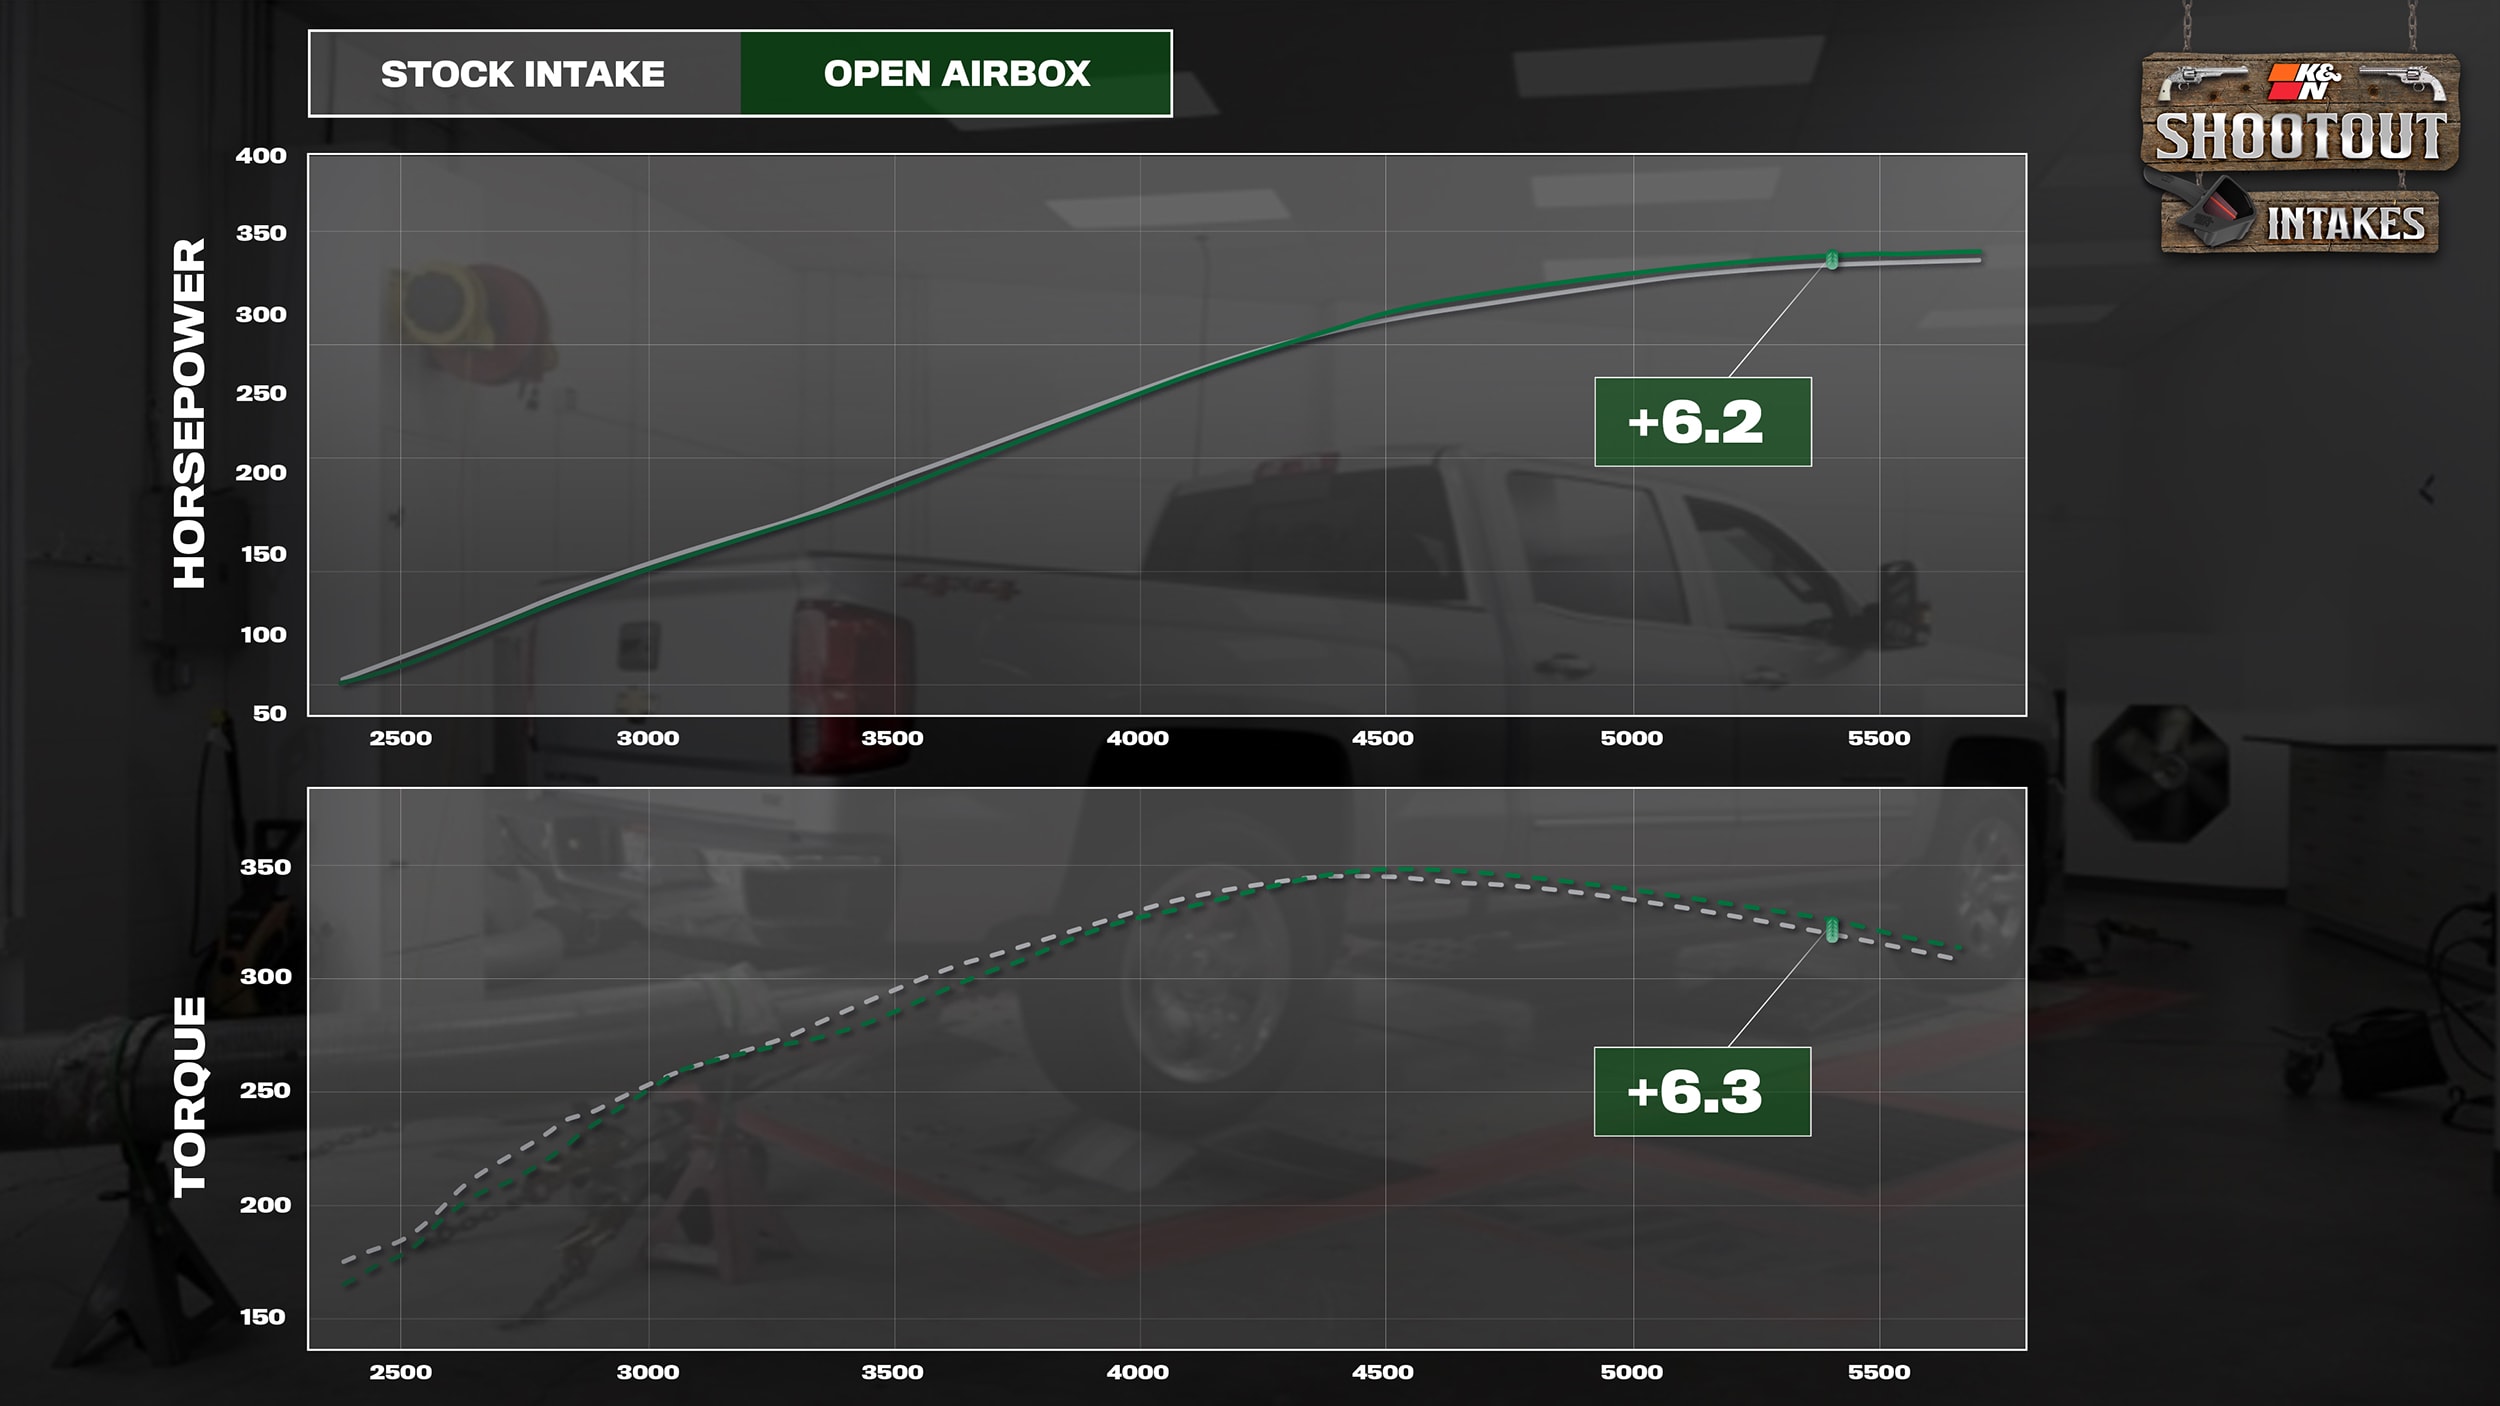
The final contestant on the dyno is the open airbox intake, showing an underwhelming gain of 6.2 horsepower and 6.3-foot pounds of torque at 5,400 RPM.
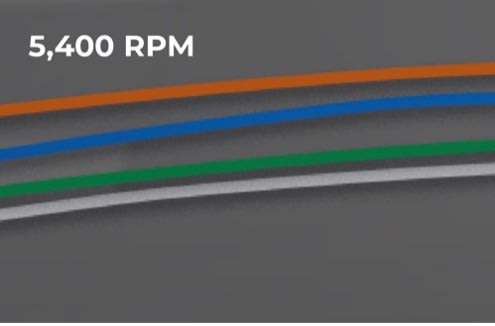
Looking at all the dyno test results, we see an obvious winner in the K&N NextGen with the peak gains being significantly higher than the other competitors, but there is much more to glean from the dyno charts than just a peak gain. One of the most important aspects of performance increases with aftermarket upgrades usable power. If you think of how you drive on a daily basis, unless you enjoy burning as much gas as possible, you’re not spending a lot of time above 4,500 RPM. Those higher RPMs are reserved for starting line acceleration, passing, on-ramps, uphill grades, or towing. The rest of the time, the power from 2,000 to 4,000 RPMs is what you will be feeling 90% of the time you’re driving.
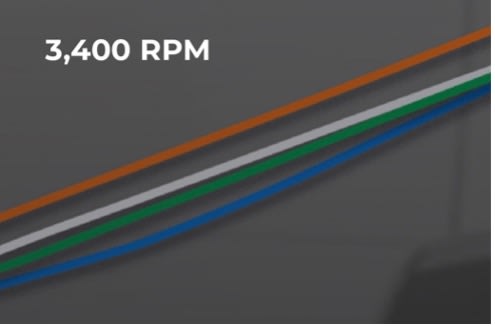
With that in mind, looking at the dyno graphs shows some sad news for the competitive intakes, as they actually LOSE power in those low and mid ranges. At 3,400 RPMs, the open airbox showed a loss of 6 horsepower from stock, while the closed box intake showed a dramatic loss of 14 horsepower compared to the stock setup. The K&N was the only intake to show consistent gains across the entire powerband, which will be felt in every driving situation.
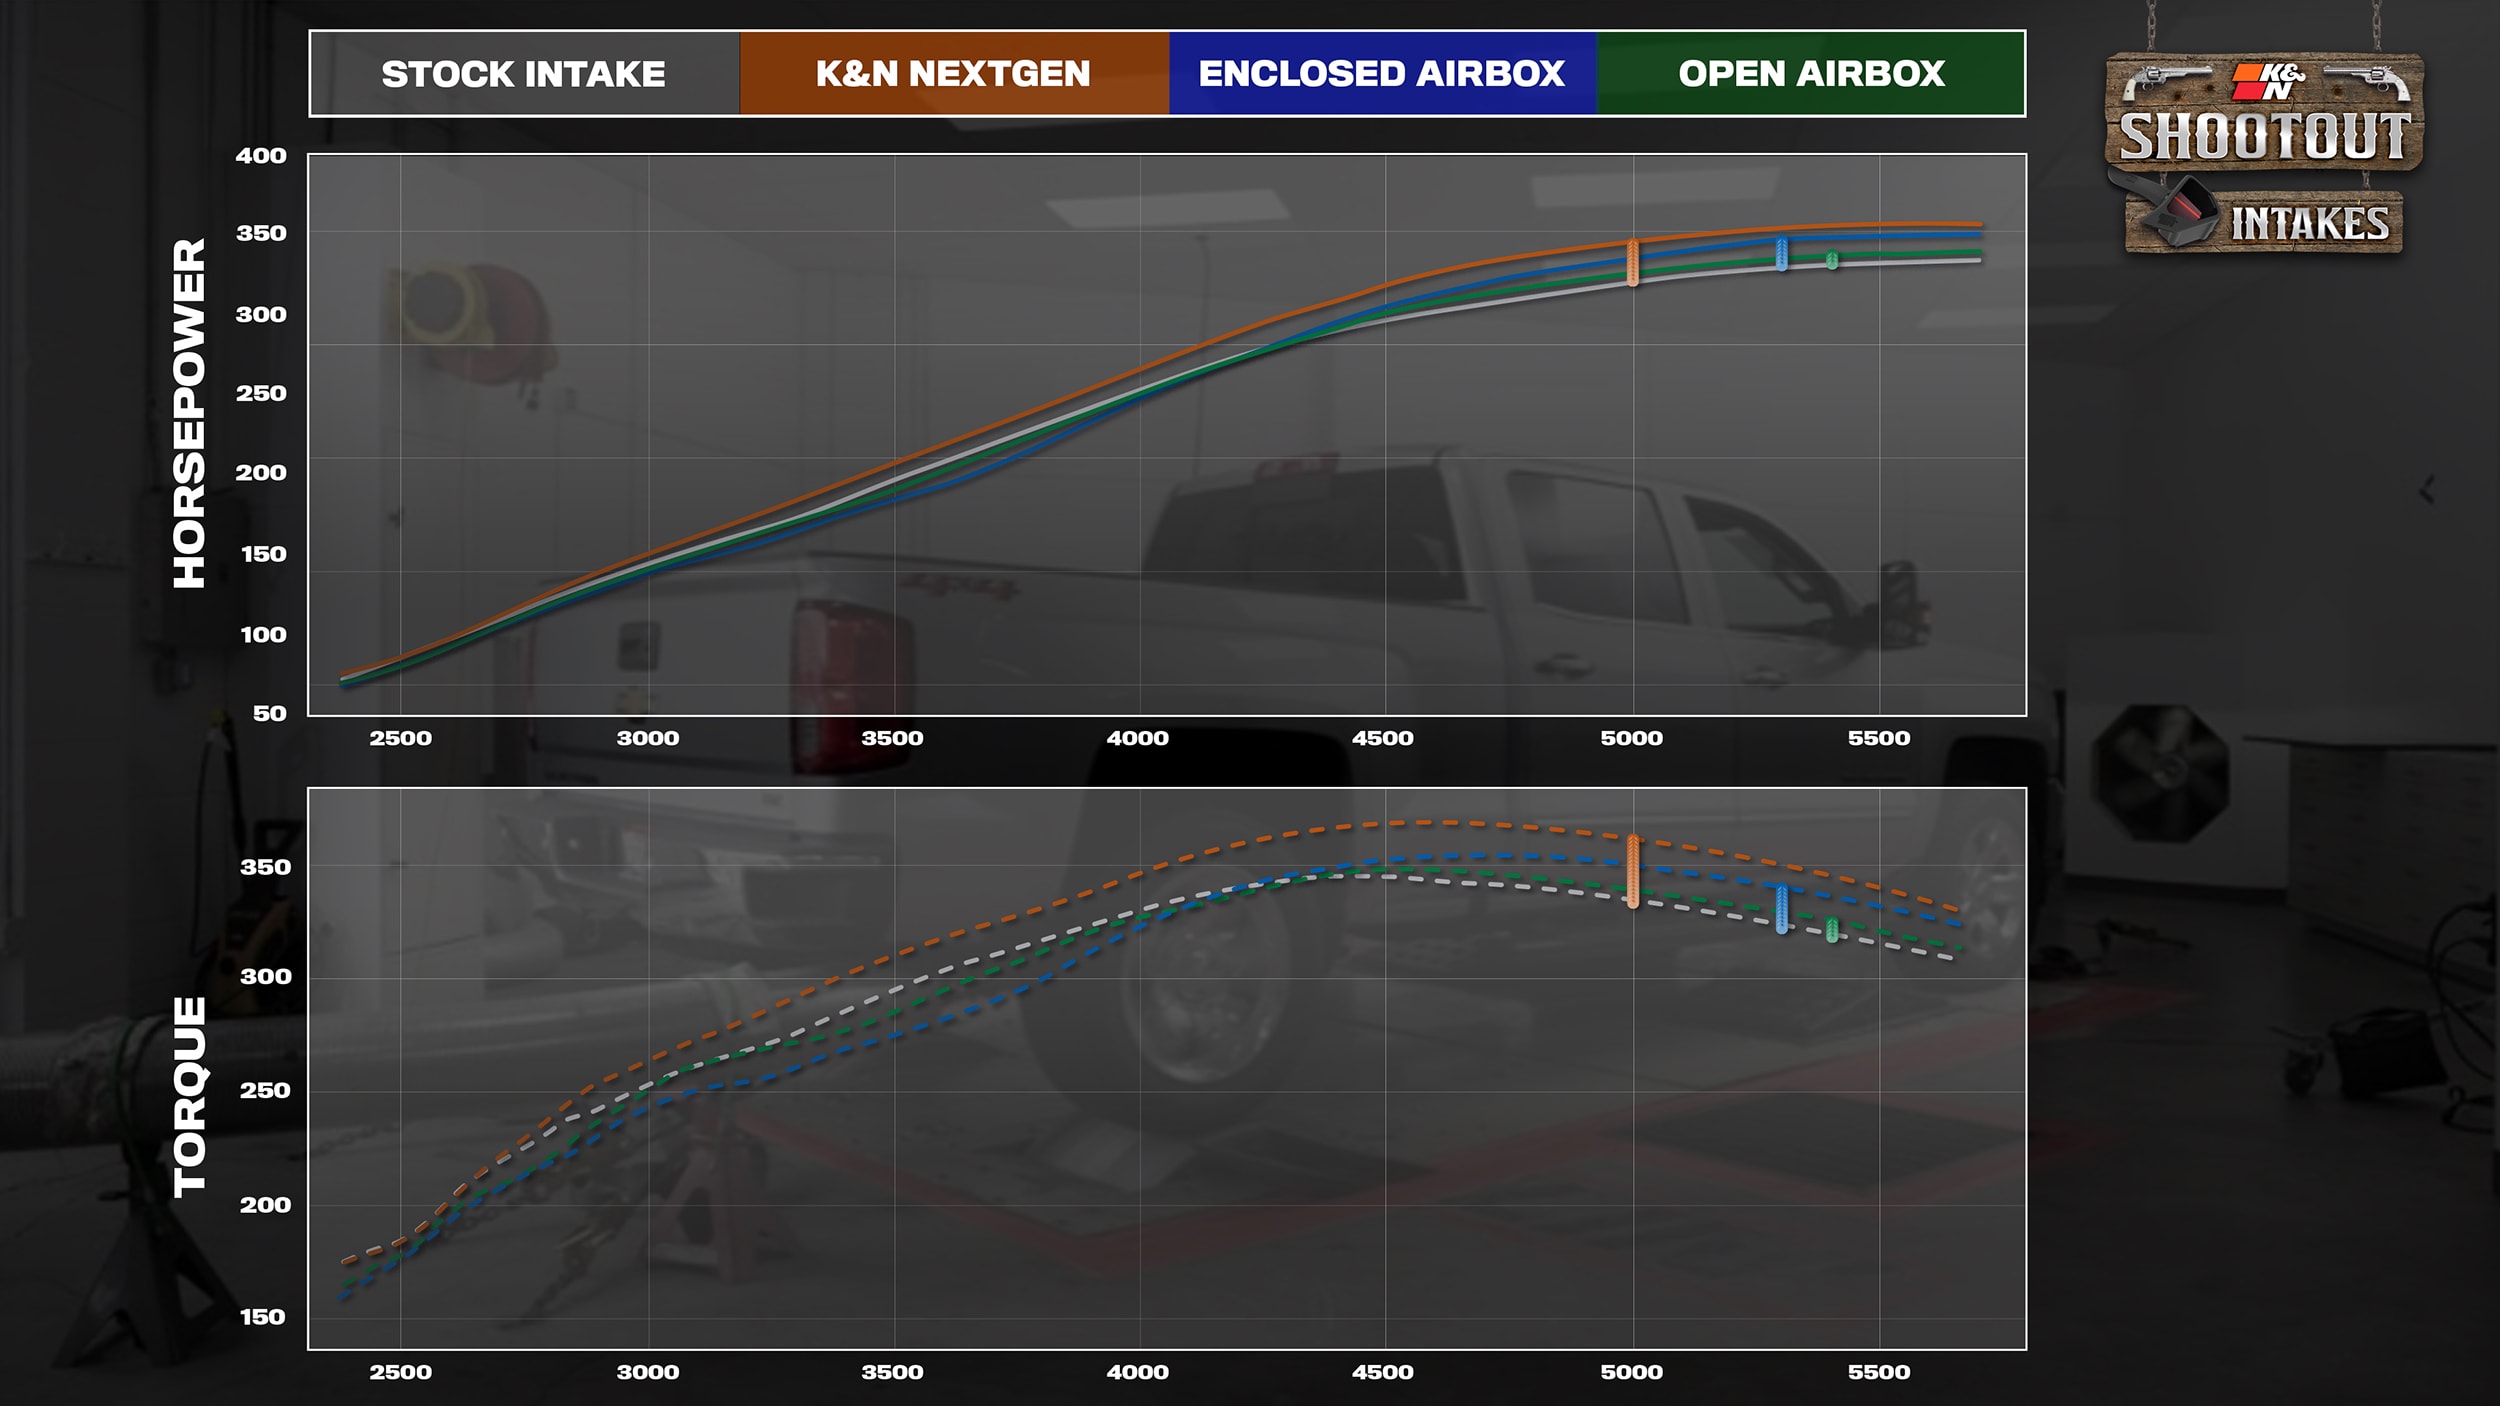
This is why looking at the entire dyno curve is so important. Just saying an intake gains 17 horsepower over stock is leaving out critical information – a loss of 14 horsepower on the low end is definitely something you would want to know before buying this closed box intake. These two sections of the dyno data tell a very different story! This is why every K&N intake sold comes with a printed dyno sheet showing the increases that can be expected for each specific intake part, so you can see all the data.
TEST 3: Acceleration and Speed on the Track
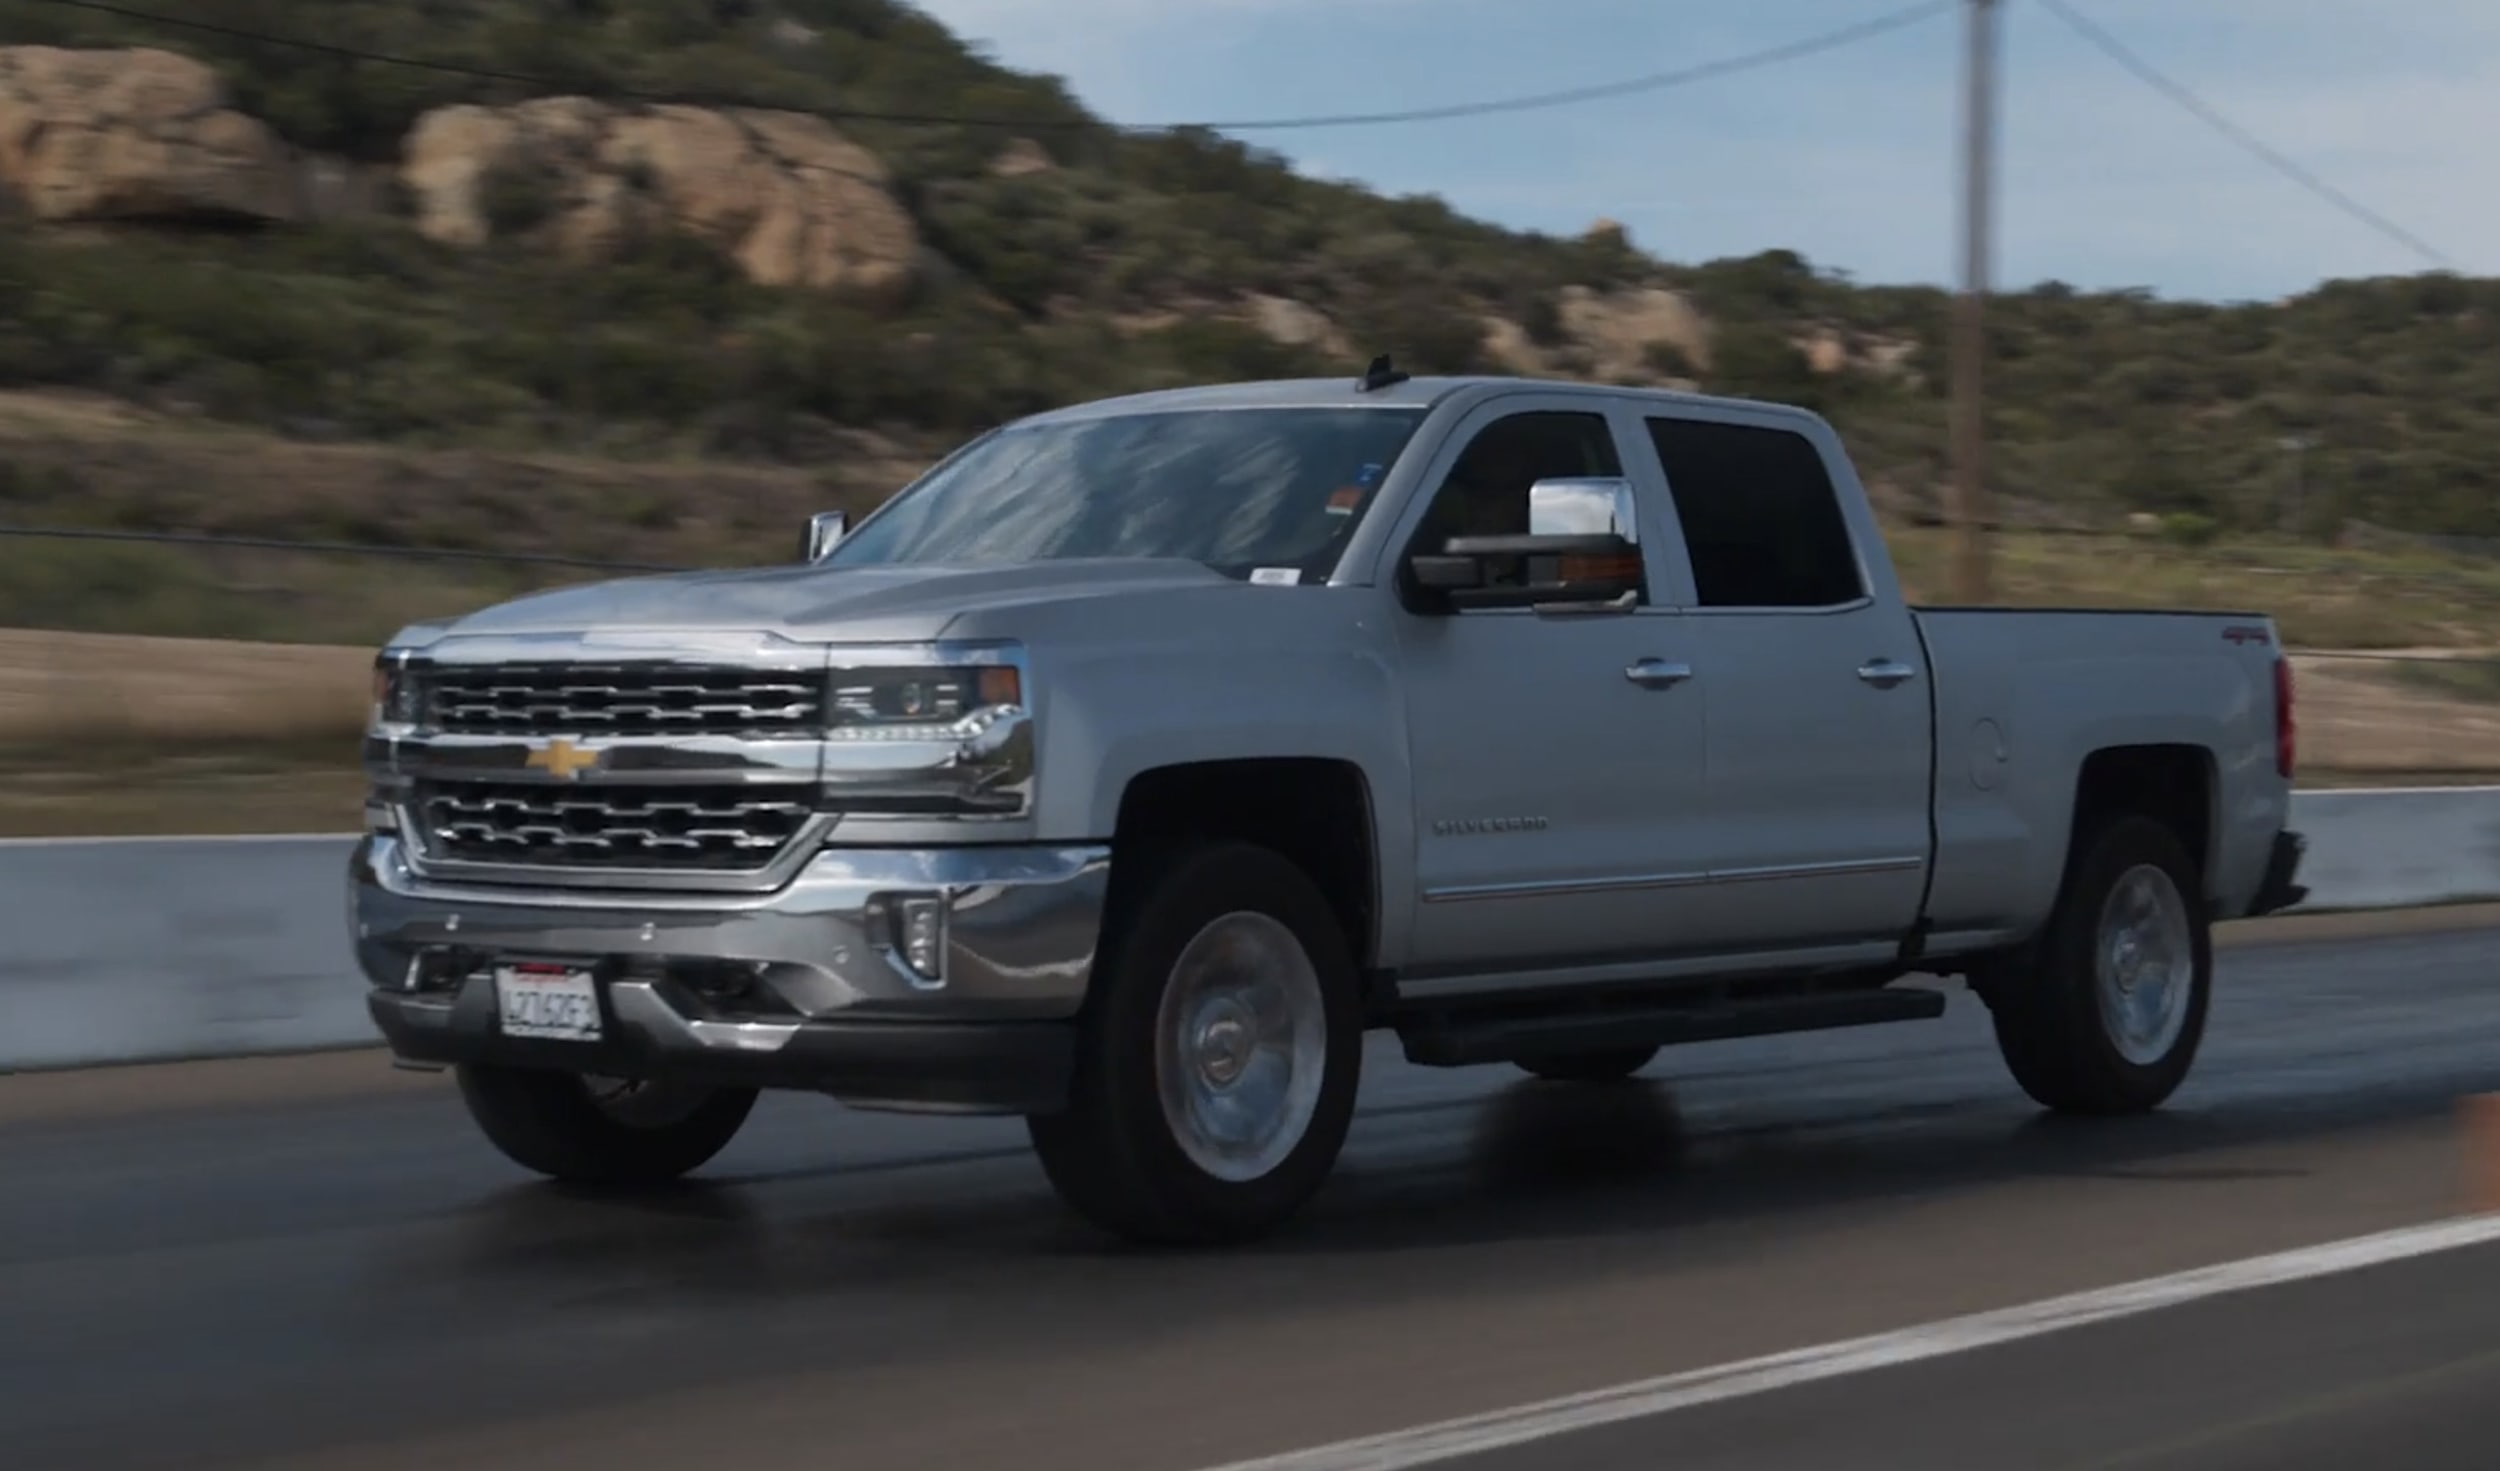
OK, enough talking, time for test three, the track! For this test, we head to the Barona Drag Strip to use their 1/8-mile strip for some real-world acceleration testing. Conveniently enough, our resident intake expert Bert, is also a long time NHRA drag racer and has made thousands of runs down the track. He will be our driver and can help ensure we are as consistent as possible with the tests – and just to keep him honest, we aren’t telling him which intake is installed so there’s no funny business, just pedal to the metal every time.

The testing procedure for the track will focus on three runs down the track for each of the intake options. Once completed, we will take the average elapsed time down the 1/8th mile and the average finish line speed for each run to get a final result. If for any reason, one run is drastically different, we will throw that one out and do another run to get three relatively consistent results for each intake. As noted earlier, we will be monitoring all the critical data in the car so we can make sure each test is as fair as possible.
The first task is to get a solid baseline with the stock intake to get a basis for comparison. After three runs with the stock configuration, we saw an average time of 10.32 seconds at 72.79 miles per hour. Despite our heckling, Bert showed off his skills on the track, showing impressively consistent times of 10.26, 10.36, and 10.34 seconds at 72.75, 73.02, and 72.61 miles per hour. This gave us a lot of confidence that any improvements on the track tests would be as accurate as possible.

With the baseline established, we randomly selected the order for the three aftermarket intakes, and kept it a secret from Bert. The closed box intake was first, showing an average time of 10.21 seconds at 73.05 miles per hour. A tenth of a second improvement wasn’t huge, but definitely noticeable over stock.
Next up was the K&N NextGen, and we were all anxious to see how those big dyno results would translate to the track. The K&N didn’t disappoint, putting down an average time of 9.98 seconds at 75.07 miles per hour, over three tenths faster, and 2.5 miles per hour faster in the 1/8th mile than the stock numbers. Pretty impressive for such a fast and easy engine upgrade!
Last on the track was the open airbox, coming in with respectable averages of 10.24 seconds and 72.63 miles per hour. Very similar results to the closed box intake at about a tenth faster than stock. Once the last runs were completed, K&N came out ahead of the pack again showing why they are the industry leaders in intakes.
COMPLETE PERFORMANCE TEST RESULTS
After much testing and enough data to make your head spin, the results were pretty obvious, with the K&N NextGen intake coming out far ahead in every test.
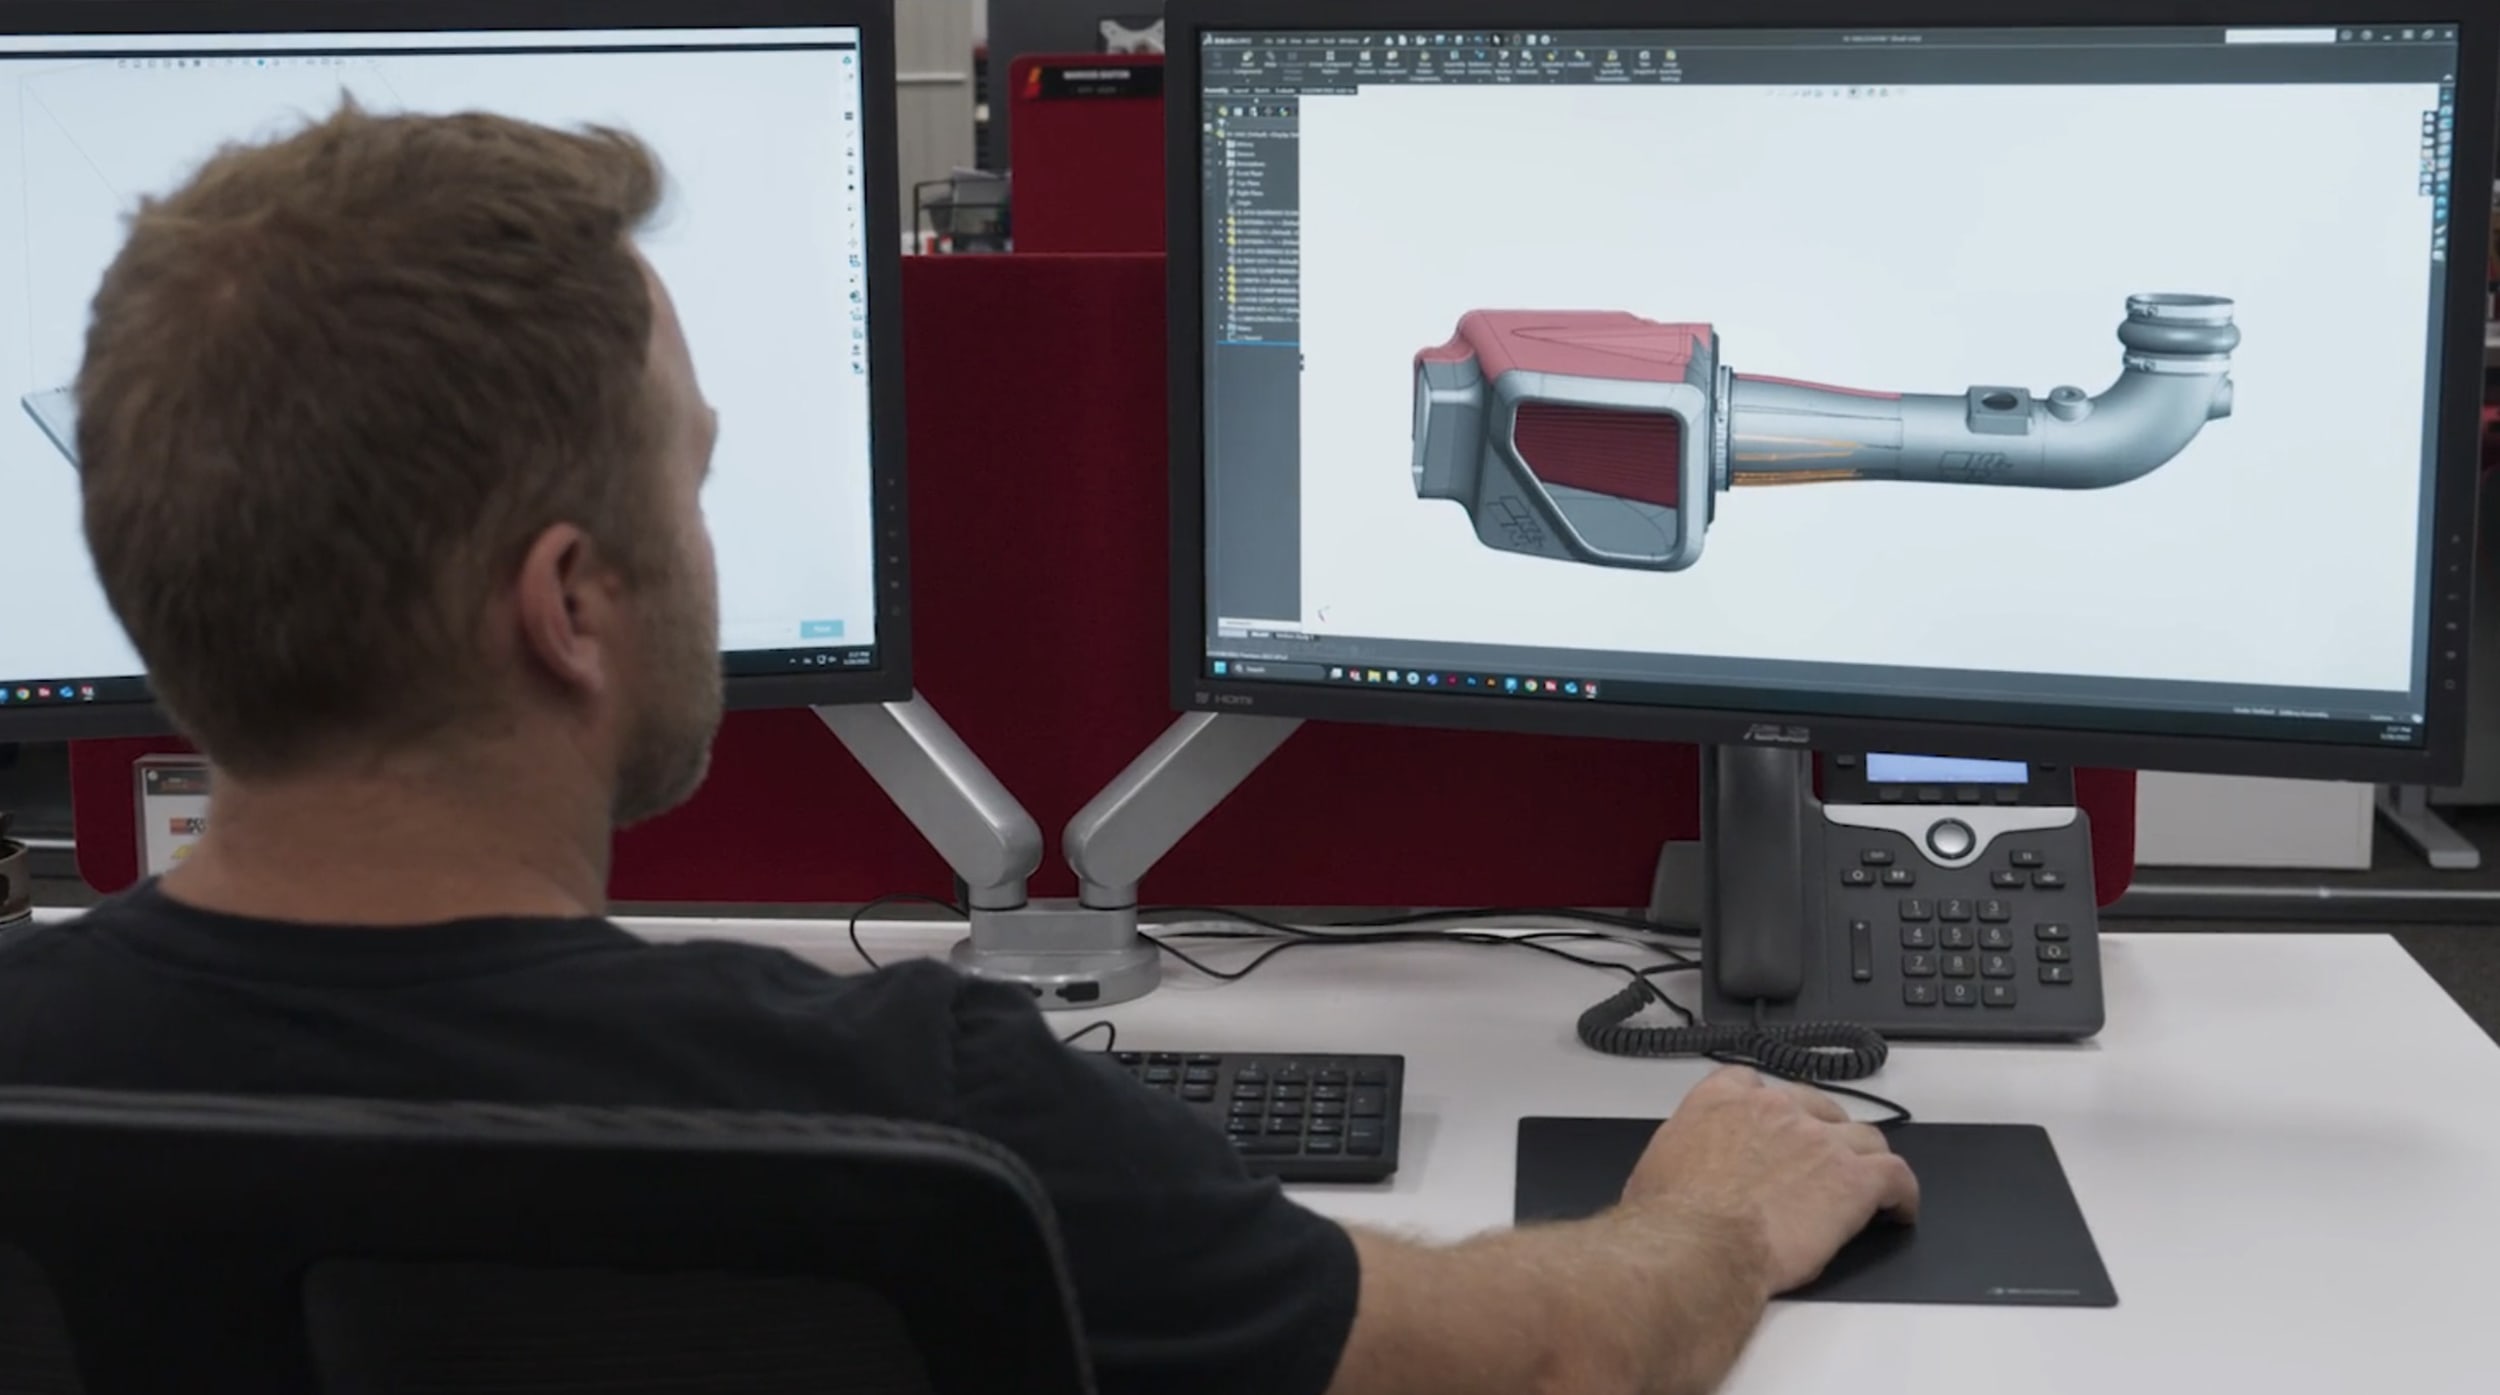
With such impressive results, we asked Bert to break down some of the reasons why the K&N intake performed so much better than the other aftermarket competitors. It comes down to a few things, most notably being the amount of engineering that goes into each K&N intake. Every element of the intake, from the air filter, to the tube, to the airbox is specifically and intentionally designed to provide the most horsepower for each specific vehicle. Once the engineers have done their job, the intake is put to the test, in every way possible. Airflow tests, filtration tests, durability tests, dyno tests, and road tests are all conducted and then conducted again. If any of the results aren’t up to K&N standards, it’s back to the drawing board. If the engineering team can’t get a result they’re happy with, we won’t release an intake for that vehicle. It’s that simple. Only intakes that make it through this rigorous process are worthy to display the K&N name. With a performance legacy of over 55 years, there is a responsibility to live up to the name that our founders created and that our customers have come to expect.
As we said initially, there are a lot of options out there and most people don’t have the ability to do this type of test comparison so we wanted to do the research and testing ourselves and the results are clear. K&N proved to be the superior intake across the board in airflow, horsepower, torque, and real world acceleration. So if you’re ready to step up to the intake shootout champ, find the intake available for your vehicle at knfilters.com and take pride in knowing that your engine is enjoying the world’s best intakes every time you hear it roar!